Studies in Variation, Contacts and Change in English
Studies in Variation, Contacts and Change in English
Steven Coats
University of Oulu
English is playing an expanding role as a language of informal online communication in many communities where it has hitherto not been widely used as a language of local communication. This is particularly evident on global social media platforms such as Twitter. Some research has found small but significant differences by gender for the use of grammatical and lexical features in spoken and written language, including online varieties such as chat, instant messaging, and Twitter (Baron 2004, Squires 2012, Bamman, Eisenstein & Schnoebelen 2014). In this study, the frequency distributions of selected standard and non-standard lexical types and their correlation with gender are considered in a corpus of English-language Twitter messages originating from Finland.
In a first step, a corpus of geo-located English-language Twitter user messages from Finland was created by accessing the Twitter Streaming API and using an automated language detection tool to remove non-English user messages. After disambiguating author gender by automated methods, the frequencies and distributional profiles of selected lexical types were examined and compared with those derived from a corpus of English-language Twitter messages worldwide subject to the same processing procedures.
The analysis supports some previous findings pertaining to gendered language use, but also suggests that the manifestation of gender in lexical type frequencies in Finland Twitter English reflects sociolinguistic considerations, particularly for those lexical features most strongly associated with the discourse of the Twitter platform itself. The analysis sheds light on the dynamics of a geographically specified online English variety and considers how sociolinguistic factors interact with technological considerations to contribute to the differentiation of online Englishes.
Technological change continues to affect patterns of human communication, and in recent years the study of English as it is manifest in Computer-Mediated Communication (CMC) has begun to take into account how the language is used online outside the core “inner circle” societies of the Anglosphere (Kachru 1992), such as in former British colonies in the Caribbean or Africa (e.g. Hinrichs 2006, Heyd & Mair 2014). The status of English as the world’s lingua franca continues to consolidate, but online English is remarkably diverse, particularly as it is used in non-L1-English contexts, to the extent that orthographical and grammatical variation in online English have been proposed to be characteristic of English as a “digital supervernacular” (Blommaert 2012). At the same time, the application of computational and corpus-linguistic methods has provided an increasingly nuanced view of the relationship between written language and the classic sociolinguistic variable of gender in various types of CMC, such as instant messaging or blogs (Baron 2004, Argamon et al. 2007).
This study investigates the intersection of online English in a non-L1 context in the specific geographic locality of Finland, and considers how it interacts with the category of gender. The method employed for the analysis of Finland-based Twitter discourse in English consists of a consideration of relative use of three classes of linguistic items: First, usage of all lexical items is compared in order to shed light on geography- and gender-based differences. Then, closer attention is paid to two phenomena that are characteristic of some types of CMC but have hitherto received relatively little attention in the context of the analysis of English varieties: expressive lengthening, the repetition of individual characters in a word string, and the use of emoticons, character-based representations of faces or other affective gestures.
Since its establishment in 2006 Twitter has become a widely-used service for the dissemination of short text messages, images, video clips, and links to other media. Twitter users post tweets (“status updates”) of up to 140 characters and can interact with others by following or responding to their tweets. As of June 2016, the site reported more than 313 million active users monthly, 79% of whom were located outside the Unites States (Twitter 2016).
In addition to the short text, a tweet contains additional information in the form of JSON attribute-value pairs, such as the author name and author screen name, the language of the user message, the various ways in which the status update refers to messages by other users, the ways in which the author has interacted with other users, the place where the user is located, or the place from which the status update was broadcast. [1] Location can be represented in two ways: A user can define location in the profile by enabling the “location” service on the Twitter web interface, which will then prompt the user with suggestions for a location to associate with the profile (typically city or province names, based on the IP address of the computer being used), or can choose to enter a location manually. For messages originating from GPS-enabled devices such as smartphones, users can select an additional option “share precise location”, which appends geographical latitude and longitude coordinates (from a GPS signal) to each individual user message in a field with the attribute “coordinates”. While locations indicated in the “location” attribute may not be accurate (either because the user has entered a different location or because the user does not change the value while changing location), the “coordinates” attribute is based on GPS signals and thus corresponds to the location of the device at the time the tweet was broadcast.
Relatively few tweets contain geographical coordinates: Leetaru et al. (2013) report 1.6% of tweets are geotagged; Morstatter et al. (2013) report 1.45–3.17%. The userbase that broadcasts GPS-tagged tweets may not be representative of the overall Twitter userbase: Pavalanathan & Eisenstein (2015) show that for a corpus of tweets collected in the United States in late 2014 and early 2015, GPS-tagged messages are more likely to be authored by young people and by females. Recent changes in the settings of mobile Twitter client software may alter the demographics of GPS-tagged tweets: Until April 2015, the default setting for the popular mobile clients Twitter for iPhone and Twitter for Android was to automatically include latitude and longitude coordinates with user messages. Newer versions of the clients do not broadcast latitude and longitude coordinates automatically – users must “opt-in”. [2]
Because it offers relatively unrestricted access to large amounts of data, Twitter posting patterns and Twitter language discourse have been analyzed by from a number of perspectives, including sentiment analysis and predictive data mining (e.g. Tumasjan et al. 2010), interactivity and temporal variation (Honeycutt & Herring 2009, Yang & Leskovec 2011), hashtag functionality (Zappavigna 2011, Page 2012, Wikström 2014, Squires 2015), language distribution (Leetaru et al. 2013, Mocanu et al. 2013), or geographical distribution and diffusion of new lexical items (Eisenstein et al. 2014). The relationship between Twitter language and the sociolinguistic variable of gender has been addressed by Rao et al. (2010), Burger et al. (2011), and Bamman, Eisenstein & Schnoebelen (2014).
Much sociolinguistic research has been devoted to the relationship between language use and gender (see, e.g. Cheshire 2002), and gender-based differences have been found in CMC genres such as instant messaging (Baron 2004) and blogs (Argamon et al. 2007). For Twitter, Rao et al. (2010: 41) found an association between female gender and the use of emoticons, expressive lengthening, and certain initialisms. For word bigrams collocating with the possessive my, they found an association between male gender and the type beer (2010: 42). Burger et al. (2011: 1305), investigating a large Twitter corpus with no geographical restrictions, found character n-grams corresponding to emoticon types, first-person singular pronouns, and emotional affect words such as love and haha were associated with female authors, whereas n-grams that correspond to the types Google and http were associated with male authors. Bamman, Eisenstein & Schnoebelen (2014: 142), analyzing a corpus of US tweets, found that emoticons, expressive lengthening, initialisms, and verbal forms associated with emotional affect were associated with female authors, while numbers, “technology words”, and profanity were associated with males.
Although some previous research has addressed the use of English on CMC in certain non-“inner circle” contexts (e.g. Vandergriff 2014), most analyses have not had a geographical focus or have been restricted to US data. For Finland, a large survey conducted in 2007 asked persons in Finland about their attitudes towards and use of English. It included several questions that address online use of English (Leppänen et al. 2011). There is an extensive research literature on the use of English in Finland, particularly in the form of qualitative case studies of individual conversations or texts utilizing methods from discourse analysis, ethnography, and interactionist analysis (e.g. Taavitsainen & Pahta 2003, Leppänen 2007, Leppänen et al. 2009). [3] English as a lingua franca has been considered on the basis of a corpus of English academic spoken language with a significant proportion of L1 Finnish speakers (Mauranen & Ranta 2008, Mauranen 2010). Investigations of CMC in Finland have mainly been conducted from a hermeneutic or discourse-analytical perspective and have considered, among other topics, ways in which English (and other languages) is used on Finnish online forums (Kytölä 2012) and the online persona of a Finnish football player as evidenced in his Twitter postings (Kytölä & Westinen 2015). Some work has been done in the preparation of a corpus of English from Finland that includes excerpts from CMC (Laitinen 2010, 2011). Coats (2016) is a corpus-based study that utilizes multidimensional analysis of grammatical feature frequencies to characterize the discourse of English-language Twitter from Finland.
This project sheds light on how gender interacts with geography by comparing English as it is used on Twitter in the specific geographical context of Finland to English from the United States. The investigation is based on the analysis of word types with high relative usage, which can provide insight not only into the propositional content of texts, but also into communicative and pragmatic orientations of authors in online contexts. The approach can be used for the consideration of non-standard lexical types, such as expressive lengthening and ASCII-character-based emoticons, which figure prominently in the discourse of some CMC genres but have not yet been the focus of sustained attention. Finally, the interaction of lexical feature frequencies (standard and non-standard) with the category of gender bears upon the complex interplay between categories of identity and functional indexicality of linguistic items, an issue that has not yet been sufficiently examined in the context of non-L1 text production, whether in CMC or other genres.
Geo-tagged tweets were collected from the Twitter Streaming API endpoint intermittently from March until May 2015. Location was filtered for Finland and the continental US by reverse geocoding tweet geo-coordinates in order to determine which tweets originated from within Finland and the US using GIS data obtained from the Global Administrative Areas database. [4] Prior to filtering, 26.9% of Finland-based tweets were in English, compared to 89.4% of US-based tweets. For further analysis, all status updates in languages other than English were removed. [5]
As it was found that a significant proportion of the (particularly US) data consisted of broadcast-style updates or advertisements (e.g. weather reports or employment opportunities) likely sent by non-human agents such as bots, effort was undertaken to remove them: Tweets by users whose screen names included the strings “careers” and “jobs” were removed from the corpora, as were tweets whose message content included strings corresponding to formulae often used in automated weather reports. Although these steps removed the most common automated messages, other messages sent by bots likely remained in the data.
Gender was disambiguated for each status update based on a procedure described in Mislove et al. (2011). In a first step, lists of the 800 most common given names for males and females were prepared from materials from the Finnish National Statistical Office and the U.S. Census Bureau. For Finland, the source data consisted of a list of 3,330 male and 4,571 female names occurring at least 10 times among all living Finnish citizens as of October 2014. [6] US names were derived from a list of 18,926 male and 22,108 female names occurring at least 5 times per decade from 1950 until 2000. [7] In a second step, all tweets were filtered for matches between the tweet metadata field “author_name” and strings that included the 800 most common male and female given names in Finland and the United States. [8] Users that matched both male and female character strings were discarded. This method assigned gender to 62.5% of the Finland tweets (35.4% male and 27.1% female) and 37.2% of the US tweets (21.1% male and 16.1% female), corresponding to 2,013 Finnish (855 female and 1158 male) and 9,859 US (4,299 female and 5,560 male) users. [9]
If only English-language tweets were considered, 58.0% of the Finland data could be gendered in this manner (24.5% male and 33.5% female): Thus users writing in English on Twitter in Finland were more likely to be female than Twitter users in Finland overall. [10] For the US-based English tweets, 37.2% of tweets were assigned gender (21.0% male and 16.2% female): The gender balance between US-based Twitter users writing in English and US-based Twitter users overall is approximately equal. [11] For comparison, Leppänen et al. (2011: 116) found that of persons in Finland who reported using English on the internet at least once per week in 2007, males reported more English use than females.
Table 1 provides a summary of the corpora and gendered subcorpora. The non-gendered English corpora comprise approximately 1.3 million tokens. The subcorpora created by inducing user gender comprise approximately 326,000 tokens.
| Subcorpus | Unique authors | Messages | Tokens |
|---|---|---|---|
| US | 25,179 | 45,033 | 551,831 |
| US English | 23,190 | 40,255 | 521,901 |
| US English Male | 5,560 | 8,452 | 116,266 |
| US English Female | 4,299 | 6,540 | 84,709 |
| Finland | 7,975 | 64,915 | 709,216 |
| Finland English | 3,548 | 17,483 | 221,291 |
| Finland English Male | 1,158 | 4,270 | 53,216 |
| Finland English Female | 855 | 5,863 | 72,144 |
Table 1. Corpora summary statistics.
Twitter users employ specific character sequences to index content and interact with one another. The username, consisting of the character <@> followed by a Unicode character string, is used to address messages to specific users on the platform. The hashtag, <#>, usually functions as an explicit marker of the topic being addressed in a specific status update. [12] Many users of the platform make liberal use of usernames and hashtags, and these entities were found to differ in the frequency between the Finland and US data (Table 2) and between males and females (Table 3).
| Corpus | Usernames | Hashtags |
|---|---|---|
| Finland | 41.52 | 54.81 |
| US | 27.26 | 40.99 |
Table 2. Frequency (per thousand tokens) of usernames and hashtags in the corpora.
Finland-based users writing in English make more frequent use of usernames and hashtags than US-based users writing in English. [13] In the gendered subcorpora, a different pattern emerges: In Finland, females make more use of usernames, while males make more use of hashtags. In the US, males make slightly more use of both usernames and hashtags (Tables 3 and 3a). [14]
| Corpus | Usernames | Hashtags |
|---|---|---|
| Finland Female | 51.21 | 42.82 |
| Finland Male | 41.87 | 87.90 |
| US Female | 28.08 | 37.56 |
| US Male | 31.89 | 41.56 |
Table 3. Frequency (per thousand tokens) of usernames and hashtags in gendered subcorpora.
The values above represent aggregate statistics for the entire datasets. When considering individual user means, however, the differences between males and females for the Finnish data are much reduced. This is due to the highly skewed distributions for these features (e.g. for some male users in the Finland data, hashtags make up a high proportion of all of their tokens).
| Corpus | Usernames | Hashtags | ||
|---|---|---|---|---|
| Mean | St.d. | Mean | St.d. | |
| Finland Female | 43.88 | 77.05 | 97.81 | 135.69 |
| Finland Male | 43.14 | 73.17 | 98.07 | 131.35 |
| US Female | 28.94 | 69.14 | 45.71 | 97.10 |
| US Male | 34.12 | 70.61 | 49.37 | 106.52 |
Table 3a. Frequency (per thousand tokens) of usernames and hashtags per user in gendered subcorpora.
The somewhat elevated rates of use of usernames in the gendered subcorpora (compared to the larger, ungendered subcorpora) may reflect the fact that these subcorpora may have higher proportions of actual human users who interact with specific other users on the platform. Automated apps or bots, on the other hand, whose “author_name” attribute name rarely corresponds to common given names, more frequently broadcast announcements than target messages to specific users. Similarly, the higher rates of use of hashtags in the gendered subcorpora may reflect the fact that bot tweets such as advertisements may not utilize hashtags as intensively as human agents.
Frequency analysis can be an important tool for the quantitative study of the discourse of individual texts, authors, or genres. Various statistical measures of association can be used to compare the frequency of a word type in two texts or two corpora, but it has been pointed out that some statistical tests are either too sensitive to differences in frequency or fail to capture them adequately, particularly for the most and least frequent words in a text. The test statistic commonly employed for the comparison of categorical count data, Pearson’s chi-squared test, may result in type I errors for high-frequency items when comparing large corpora (i.e. a significant difference in use may be detected for common words where no such difference exists: Kilgarriff 2001) and give misleading values for low-frequency items. Other approaches that have been suggested include log-likelihood measures (Dunning 1993), t-testing of mean frequency values in multiple corpus subsections or in chunks constructed using bootstrapping or other random sampling techniques, or utilizing non-parametric test statistics such as the Wilcoxon rank-sum test (Paquot & Bestgen 2009, Lijffijt et al. 2016). Fisher’s exact test does not presume an underlying normal distribution and is sometimes considered a superior statistical test for count data, but has not been used as widely as the chi-squared test, possibly due to the computational resources required for the calculation of confidence intervals around the hypergeometric function (Evert and Baroni 2008: 792).
For the data under consideration, the discounted logarithmic odds ratio θ, a measure of effect size, was selected to compare frequencies among the Twitter corpora, according to the following procedure: For each lexical item occurring at least 5 times in both the Finland data and the non-Finland data, the number of unique users employing the type was calculated for three comparison sets: Finland vs. US, Finland females vs. Finland males, and US females vs. US males. [15] Then θ was calculated for all lexical types in the corpora from the contingency table cell frequencies of occurrence and non-occurrence, according to the formula ![]() (Table 4).
(Table 4).
| corpus1 | corpus2 | |
|---|---|---|
| word | O11 | O12 |
| ~word | O21 | O22 |
Table 4. Contingency table for calculation of relative frequencies.
The statistic, a parameter of log-linear models, does not require the assumption that data is normally distributed, and as an effect size measure may be better suited to gauging differences between samples of different sizes than some tests of statistical significance (Agresti 2002: 44–47, Evert 2004: 83–84). A value of 0 indicates equal use by the tested groups. Types with more extreme values (positive or negative) are lexemes most closely associated with the discourse of the corresponding group. In the following tables, the types with the most extreme θ values are reported.
Because some of the frequencies in the derived contingency tables are low, an indication of significance according to the p-values calculated from Fisher’s exact test is provided. The vectorized function provided by Evert (2012) has been employed for the calculation of p-values.
The most Finnish and most American types are seen in Table 5. Three of the most overrepresented types in the Finland data are emoticons (:d, :3, and :))). Several types reference technology (android, apps, and vid: inspection of concordances shows that source and content almost always refer to websites or online content). The other highly “Finnish” word types reference work or school/university life (customers, studying), geographical entities (london and senate, used in the context of Helsinki’s Senate Square), adversity (problems, failed), and a climate condition frequently experienced in Finland (freezing), among other types.
Several of the types with the lowest θ values reference entities associated with the geographical and cultural situation of the United States: starbucks, york (in the collocation New York), california, united (in United States), and st (abbreviation for ‘street’ and ‘saint’). Several other types are common elements in place names (beach, lake, park, island). Notable among the most typical American types is the presence of the non-standard word forms tryna (‘trying to’) and em (‘him/them’).
| Type | θ | Total freq | Unique users Finland | Unique users US | Sig. | Type | θ | Total freq | Unique users Finland | Unique users US | Sig. | |
|---|---|---|---|---|---|---|---|---|---|---|---|---|
| 1 | :d | 4.51 | 220 | 27 | 1 | *** | starbucks | -2.21 | 177 | 1 | 66 | *** |
| 2 | android | 4.16 | 62 | 6 | 0 | *** | husband | -1.55 | 42 | 0 | 11 | |
| 3 | apps | 3.99 | 13 | 5 | 0 | *** | beach | -1.55 | 361 | 4 | 102 | *** |
| 4 | customers | 3.99 | 22 | 5 | 0 | *** | em | -1.46 | 74 | 0 | 10 | |
| 5 | :3 | 3.79 | 45 | 13 | 1 | *** | lake | -1.40 | 174 | 2 | 49 | ** |
| 6 | london | 3.79 | 43 | 13 | 1 | *** | tryna | -1.36 | 64 | 0 | 9 | |
| 7 | could've | 3.79 | 16 | 4 | 0 | ** | park | -1.32 | 443 | 8 | 154 | *** |
| 8 | problems | 3.79 | 37 | 4 | 0 | ** | york | -1.30 | 394 | 3 | 62 | ** |
| 9 | freezing | 3.79 | 16 | 4 | 0 | ** | international | -1.27 | 351 | 8 | 146 | *** |
| 10 | failed | 3.79 | 12 | 4 | 0 | ** | senior | -1.25 | 90 | 1 | 25 | |
| 11 | stunning | 3.79 | 16 | 4 | 0 | ** | butt | -1.25 | 52 | 0 | 8 | |
| 12 | vid | 3.79 | 69 | 4 | 0 | ** | st | -1.21 | 360 | 1 | 24 | |
| 13 | ages | 3.79 | 25 | 4 | 0 | ** | community | -1.21 | 63 | 1 | 24 | |
| 14 | studying | 3.71 | 40 | 12 | 1 | *** | california | -1.12 | 183 | 2 | 37 | |
| 15 | senate | 3.63 | 33 | 11 | 1 | *** | !!!! | -1.12 | 234 | 0 | 7 | |
| 16 | someday | 3.54 | 21 | 10 | 1 | *** | everywhere | -1.12 | 43 | 0 | 7 | |
| 17 | thumbs | 3.54 | 18 | 3 | 0 | ** | fitness | -1.10 | 140 | 3 | 51 | * |
| 18 | :)) | 3.54 | 26 | 3 | 0 | ** | island | -0.91 | 120 | 2 | 30 | |
| 19 | source | 3.54 | 16 | 3 | 0 | ** | united | -0.87 | 74 | 1 | 17 | |
| 20 | content | 3.54 | 15 | 3 | 0 | ** | waking | -0.81 | 74 | 2 | 27 | |
Significance (Fisher’s exact test p-value): * < 0.05, ** < 0.01, *** < 0.001 |
||||||||||||
Table 5. Lexical features: Finland vs. US.
For the gendered subcorpora of the Finland English data, the lexical types with the highest and lowest discounted log-odds ratios shed light on gender-related discourse differences (Table 6). The types most overrepresented among female users include verbal and noun forms whose semantics index interpersonal interaction (write, kiss, dancing, dance, laughing, swear), words related to positive affect and emotional state (aww, babe, ily [‘I love you’]), adverbials (exactly, af [‘as fuck’]), as well as nouns that can be associated with entertainment (voice, songs, followers).
The forms most strongly associated with male users in the Finland data refer to alcohol (ipa, beer, pale, ale, pub), technology (games, android, mobile, players, microsoft, systems), geographical entities (route, east), hockey/sports (finals, arena [used in the collocation Hartwall Arena]), or working life (customers).
| Type | θ | Total freq | Unique users female | Unique users male | Sig. | Type | θ | Total freq | Unique users female | Unique users male | Sig. | |
|---|---|---|---|---|---|---|---|---|---|---|---|---|
| 1 | write | 3.69 | 72 | 14 | 0 | *** | ipa | -2.84 | 37 | 0 | 11 | ** |
| 2 | voice | 3.36 | 71 | 10 | 0 | *** | beer | -2.75 | 110 | 0 | 10 | ** |
| 3 | aww | 3.36 | 50 | 10 | 0 | *** | arena | -2.75 | 55 | 0 | 10 | ** |
| 4 | babe | 3.26 | 77 | 9 | 0 | *** | pale | -2.65 | 25 | 0 | 9 | * |
| 5 | bored | 3.26 | 50 | 9 | 0 | *** | ale | -2.54 | 36 | 0 | 8 | * |
| 6 | exactly | 3.26 | 77 | 9 | 0 | *** | national | -2.41 | 134 | 0 | 7 | * |
| 7 | outside | 3.26 | 105 | 9 | 0 | *** | security | -2.41 | 44 | 0 | 7 | * |
| 8 | ily | 3.26 | 52 | 9 | 0 | *** | games | -2.27 | 46 | 0 | 6 | |
| 9 | kiss | 3.26 | 34 | 9 | 0 | *** | finals | -2.27 | 93 | 0 | 6 | |
| 10 | dancing | 3.15 | 44 | 8 | 0 | ** | android | -2.27 | 62 | 0 | 6 | |
| 11 | annoying | 3.15 | 59 | 8 | 0 | ** | route | -2.10 | 20 | 0 | 5 | |
| 12 | dance | 3.15 | 94 | 8 | 0 | ** | east | -2.10 | 131 | 0 | 5 | |
| 13 | laughing | 3.15 | 45 | 8 | 0 | ** | mobile | -2.10 | 24 | 0 | 5 | |
| 14 | songs | 3.15 | 52 | 8 | 0 | ** | setting | -2.10 | 18 | 0 | 5 | |
| 15 | af | 3.02 | 137 | 7 | 0 | ** | players | -2.10 | 45 | 0 | 5 | |
| 16 | followers | 3.02 | 36 | 7 | 0 | ** | microsoft | -2.10 | 19 | 0 | 5 | |
| 17 | alive | 3.02 | 46 | 7 | 0 | ** | pub | -2.10 | 22 | 0 | 5 | |
| 18 | asleep | 3.02 | 87 | 7 | 0 | ** | systems | -2.10 | 18 | 0 | 5 | |
| 19 | swear | 3.02 | 22 | 7 | 0 | ** | customers | -2.10 | 52 | 0 | 5 | |
| 20 | cutest | 3.02 | 73 | 7 | 0 | ** | against | -1.90 | 106 | 1 | 13 | ** |
Significance (Fisher’s exact test p-value): * < 0.05, ** < 0.01, *** < 0.001 |
||||||||||||
Table 6. Lexical features: Finland female vs. male.
The American data sorted by user gender (Table 7) shows some similarities to patterns found in the Finnish data. For females, non-standard word forms associated with the negotiation of stance and interaction figure prominently (pls [‘please’], writing, hugs). Other highly “female” types include noun forms (milk, makeup, tattoo, pet, jacket) and words referencing emotional states (aw, omfg [‘oh my fucking god’], adorable).
For the male gendered American data, an alcohol-related term (ipa) is among the most prominent word types, as are types that have to do with computer gaming and technology (games, iphone). The proper noun jackson (referring in the data to the persons Andrew, Stonewall, Michael, and Janet, as well as several places) is present, as are terms associated with the music industry (dj, record). An adjective among the 20 most female types is adorable, while the male data includes the adjective types poor, wet, normal, horrible, and powerful.
| Type | θ | Total freq | Unique users female | Unique users male | Sig. | Type | θ | Total freq | Unique users female | Unique users male | Sig. | |
|---|---|---|---|---|---|---|---|---|---|---|---|---|
| 1 | aw | 2.97 | 39 | 7 | 0 | ** | games | -2.69 | 46 | 0 | 9 | * |
| 2 | pls | 2.46 | 57 | 4 | 0 | dj | -2.58 | 44 | 0 | 8 | * | |
| 3 | purpose | 2.46 | 23 | 4 | 0 | poor | -2.58 | 52 | 0 | 8 | * | |
| 4 | kidding | 2.46 | 27 | 4 | 0 | held | -2.45 | 47 | 0 | 7 | * | |
| 5 | omfg | 2.46 | 34 | 4 | 0 | ipa | -2.45 | 37 | 0 | 7 | * | |
| 6 | milk | 2.46 | 34 | 4 | 0 | iphone | -2.45 | 98 | 0 | 7 | * | |
| 7 | makeup | 2.46 | 29 | 4 | 0 | jackson | -2.45 | 30 | 0 | 7 | * | |
| 8 | writing | 2.46 | 39 | 4 | 0 | begins | -2.45 | 36 | 0 | 7 | * | |
| 9 | collection | 2.46 | 39 | 4 | 0 | wet | -2.45 | 31 | 0 | 7 | * | |
| 10 | pet | 2.46 | 25 | 4 | 0 | moves | -2.31 | 28 | 0 | 6 | ||
| 11 | grow | 2.30 | 49 | 11 | 1 | ** | note | -2.31 | 29 | 0 | 6 | |
| 12 | adorable | 2.20 | 30 | 3 | 0 | appreciate | -2.31 | 44 | 0 | 6 | ||
| 13 | tattoo | 2.20 | 36 | 3 | 0 | record | -2.31 | 39 | 0 | 6 | ||
| 14 | fail | 2.20 | 23 | 3 | 0 | normal | -2.14 | 44 | 0 | 5 | ||
| 15 | ?! | 2.20 | 135 | 3 | 0 | horrible | -2.14 | 41 | 0 | 5 | ||
| 16 | hugs | 2.20 | 22 | 3 | 0 | ground | -2.14 | 34 | 0 | 5 | ||
| 17 | pretend | 2.20 | 14 | 3 | 0 | powerful | -2.14 | 22 | 0 | 5 | ||
| 18 | 6am | 2.20 | 20 | 3 | 0 | joke | -2.14 | 45 | 0 | 5 | ||
| 19 | headache | 2.20 | 25 | 3 | 0 | size | -2.14 | 38 | 0 | 5 | ||
| 20 | jacket | 2.20 | 25 | 3 | 0 | chose | -2.14 | 17 | 0 | 5 | ||
Significance (Fisher’s exact test p-value): * < 0.05, ** < 0.01, *** < 0.001 |
||||||||||||
Table 7. Lexical features: US female vs. male.
Overall, the lexical types most characteristic of Finland-based or American-based discourse on Twitter may reflect an orientation of the users of the service towards local entities (e.g. place or company names), particularly for the US data. The more “Finnish” types include three emoticons (discussed further below).
Differences in language according to induced gender pattern somewhat similarly in Finland and the United States. Types associated with the positioning and negotiation of stance and emotional content, whether standard word forms or non-standard word forms such as initialisms, figure more prominently in the subcorpora with female induced gender, whereas males tend to utilize types associated with alcohol and technology.
Some genres of CMC are especially rich in non-standard orthography and grammar. Twitter, along with some other social media platforms, contains a large number of status updates written in highly informal, non-standard language, to such an extent that some traditional corpus-linguistic procedures for the preparation of data (e.g. removal of all punctuation during corpus tokenization) may yield less than fruitful results when the discourse is to be characterized. Two features that figure prominently in Twitter and other social media are considered here more closely: expressive lengthening and the use of emoticons.
Non-standard orthography has received some attention in the linguistic sociology and sociolinguistics literature in recent years (Sebba 2007, Jaffe et al. 2012), and orthographical variation has been shown to be a relatively frequent feature of certain types of CMC (Paolillo 2001, Ling 2005, Tagliamonte & Denis 2008). Expressive lengthening refers to a particular type of non-standard orthography: the repetition of individual characters in a word string (e.g. cooool, ohhhh), which may have functional correspondence to vowel quantity lengthening in spoken language. Riordan & Kreuz (2010) considered expressive lengthening (termed “vocal spelling”) in five different CMC subcorpora and suggested that the feature is mainly used to express emotional affect and strengthen assertions. Schnoebelen (2012b: 193), analyzing expressive lengthening in a corpus of Twitter messages, suggested it communicates prosodic features. Kalman & Gergle (2014) considered the feature in a corpus of e-mail messages to be an emulation of a spoken linguistic cue. Longer segment duration in spoken language is perceived by listeners as more emotional (Fry 1955, Klatt 1976); to that extent, it may be the case that expressive lengthening in CMC and on Twitter has a similar role as an affect marker.
On Twitter, expressive lengthening has been shown to co-occur with emoticon types (Schnoebelen 2012b) and is associated with female gender (Rao et al. 2010, Bamman, Eisenstein & Schnoebelen 2014). To investigate the comparative use of this feature in the data, all cases in which a token contained from three to ten characters repeated in sequence were identified. Tokens containing the string “www.” were filtered to remove URLs, and username and hashtag tokens were not counted as instances of expressive lengthening. Instances were sorted according to character lengthened and length of the lengthening in number of characters.
Overall, Finland English tweets exhibit approximately 17% more expressive lengthening than US English tweets, as shown in Table 8. [16]
| Corpus | Lengthened tokens/1000 tokens |
|---|---|
| Finland English | 2.49 |
| US English | 2.13 |
Table 8. Expressive lengthening, Finland and US.
An explanation for the higher rates of lengthening in the Finnish data is not immediately apparent, but as younger users have been shown to employ non-standard features such as expressive lengthening more frequently than older users (Pavalanathan & Eisenstein 2015), it may be the case that the Finland data are more skewed towards younger users. [17] The most frequent types exhibiting expressive lengthening in the Finland and US data are shown in Figure 1.
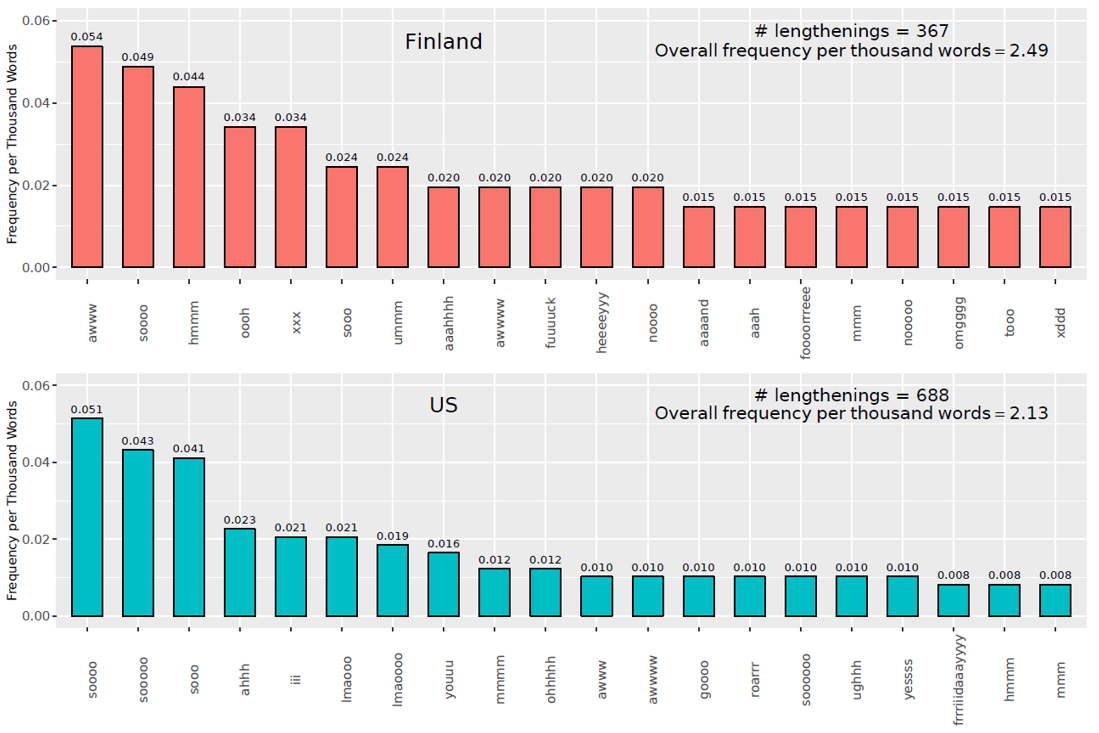
Figure 1. Twenty most frequent expressive lengthening types in Finland and the US.
Several of the most frequent types (awww, soooo, hmmm, sooo, awwww, mmm) are shared by both corpora. The most frequent other types in the Finland data consist of lengthened dictionary words (fuuuck, heeeeyyy, noooo, aaaand, foooorrreee, nooooo, and tooo), lengthened pronounceable non-dictionary words corresponding to written forms of verbal communication (oooh, ummm, aaahhh, aaah), and lengthened non-pronounceable non-dictionary words (xxx, usually used to represent three kisses, omgggg, from ‘oh my god’, and xddd, an emoticon type meant to represent laughter. [18] The most frequent other types in the US data are dictionary words (sooooo, iii, youuu, goooo, roarrr, soooooo, yessss, and frrriiidaaayyyy), pronounceable non-dictionary words (ahhh, mmmm, ughhh), and non-pronounceable non-dictionary words (lmaooo and lmaoooo, ‘laughing my ass off’).
Among the most frequent types, the Finnish and US corpora are comparable in terms of standard dictionary words and pronounceable interjection types, but non-pronounceable types such as internet-typical initialisms or emoticons are slightly more prevalent in the Finland data among the most frequent types.
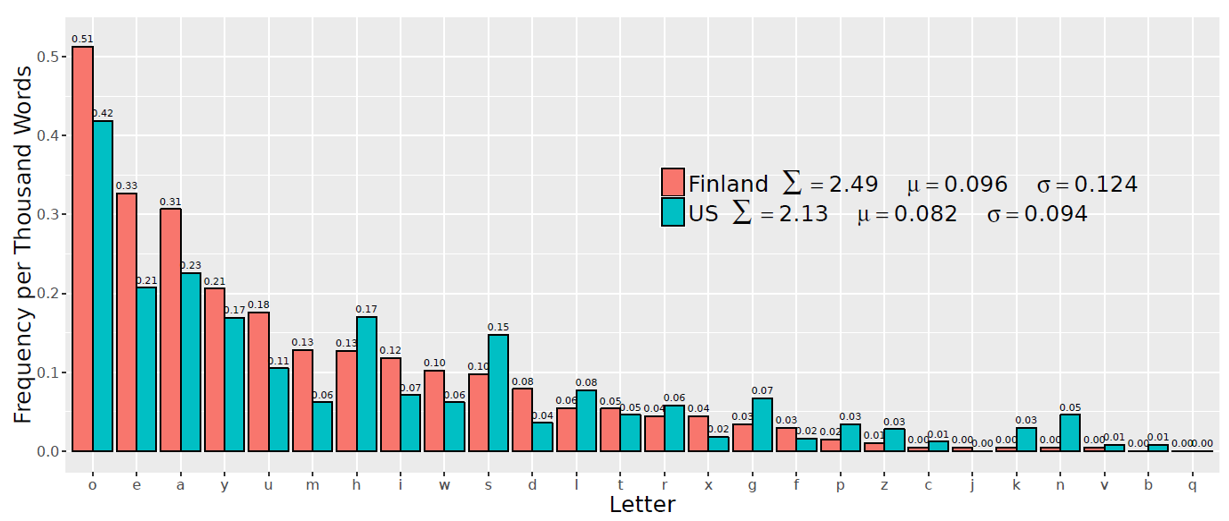
Figure 2. Expressive lengthening by repeated letter, Finland and US.
The characters that are most frequently lengthened differ somewhat for the Finland and US corpora. As Figure 2 indicates, for both the Finland and the US data, the letter o is the most susceptible to lengthening: tokens with lengthened o sequences occur at a rate of 0.51 per thousand words in the Finland data and 0.42 per thousand words in the US. Vowel characters are more subject to lengthening in both data sets, with characters representing open and mid vowels /o/, /e/, and /a/ more likely to be lengthened than those that represent close vowels /i/ and /u/ or the semi-vowel /j/. Among non-vowel characters, h is most subject to lengthening, followed by s, m, l, d, and r. The characters t, g, x, f, and p are less likely to be subject to lengthening, and the characters z, k, n, c, j, v, b, and q are the least likely to be lengthened. As the shape of the overall profile in Figure 2 indicates, the relative likelihood of letters being lengthened is not substantially different for Finland and the US overall, although there are some discrepancies: As a proportion of characters that are lengthened, Finnish users are more likely to lengthen vowels and the consonants x, m, d, f, and w; US users are more likely to lengthen the consonants b, n, k, z, c, p, g, and v. [19]
In terms of the length of lengthenings, US lengthenings are slightly longer, on average: The mean number of lengthened characters per lengthening is 4.34 for the US lengthenings and 4.10 for the Finland lengthenings. Lengthening itself seems to be subject to a length constraint: For the Finland data, 45% of lengthenings contain 3-character sequences, 28% 4-character sequences, 13% 5-character sequences, 7% 6-character sequences, 4% 7-character sequences, and 3% sequences of more than 7 characters. For the US data, the proportions are 36% 3-character, 29% 4-character, 17% 5-character, 9% 6-character, 5% 7-character, and 4% more than 7-character. This rank-frequency profile exhibits a Zipfian distribution: It may represent a balance between communicative economy considerations, individual stylistic preferences, and locally negotiated meanings, all of which are manifest in aggregate language use phenomena (Piantadosi, Tily & Gibson 2011, Kretzschmar 2009).
Females exhibit higher rates of expressive lengthening than males: 150% higher in Finland and 120% higher in the US. [20]
| Corpus | Lengthened tokens/1000 tokens |
|---|---|
| Finland Female | 3.08 |
| Finland Male | 1.23 |
| US Female | 2.25 |
| US Male | 1.02 |
Table 9. Expressive lengthening by gender, Finland and US.
The most frequent types according to gender in Finland (Figure 3) are somewhat comparable. The only shared type is hmmm. The other types among the 20 most frequent for females are 11 lengthened standard word forms (three profanities, two negators, a contrastive conjunction, an adverb, an interjection, a first-person pronoun, and two politeness markers) and eight pronounceable non-dictionary words. For Finland males, there are 13 lengthened word forms (a greeting, a place name [eeeeespoooon and eeeespooon, ‘Espoo’], a first-person personal pronoun, a conjunction, a non-standard-orthography affirmation particle [yaaaassss], two adjectives, a non-standard word for breasts [booobies]), and six pronounceable non-dictionary words.
Although the sample sizes are small, among the most common female lengthened forms there are more markers of affect or interaction (interjections, profanities, politeness markers), while among the most common male forms there are more types associated with information (place names, nouns, adjectives).
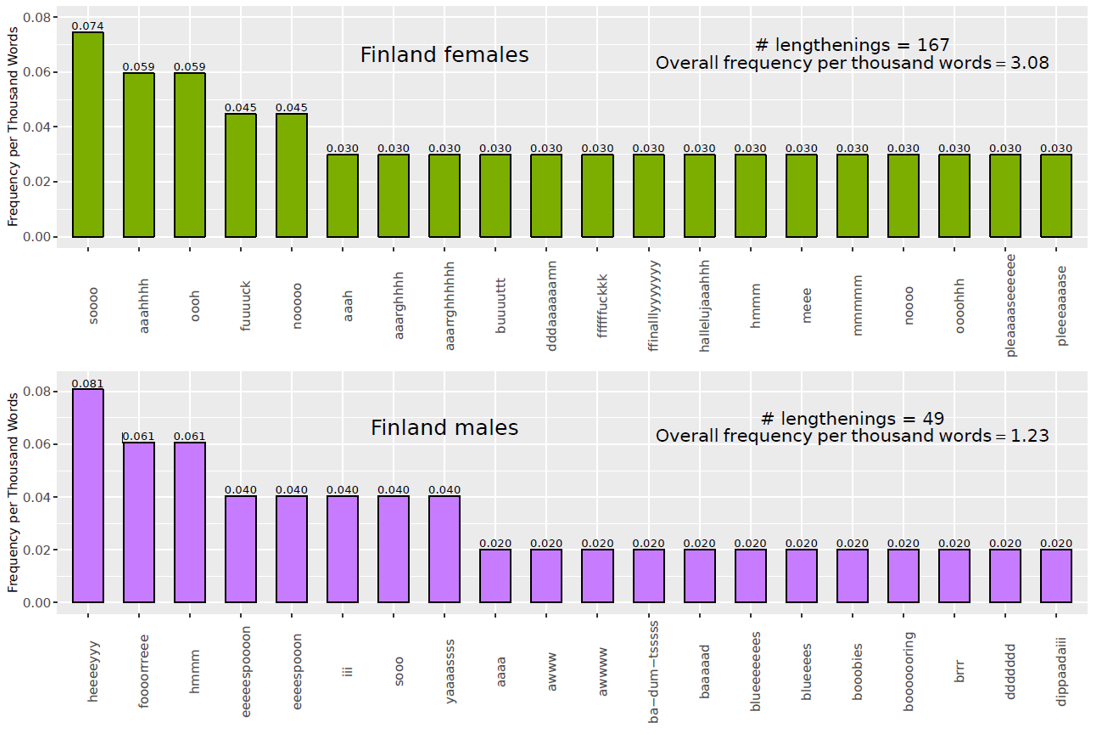
Figure 3. Twenty most frequent expressive lengthening types in Finland by gender.
In terms of letter lengthened, the overall profile of lengthening by letter and gender (Figure 4) differs between males and females. [21]
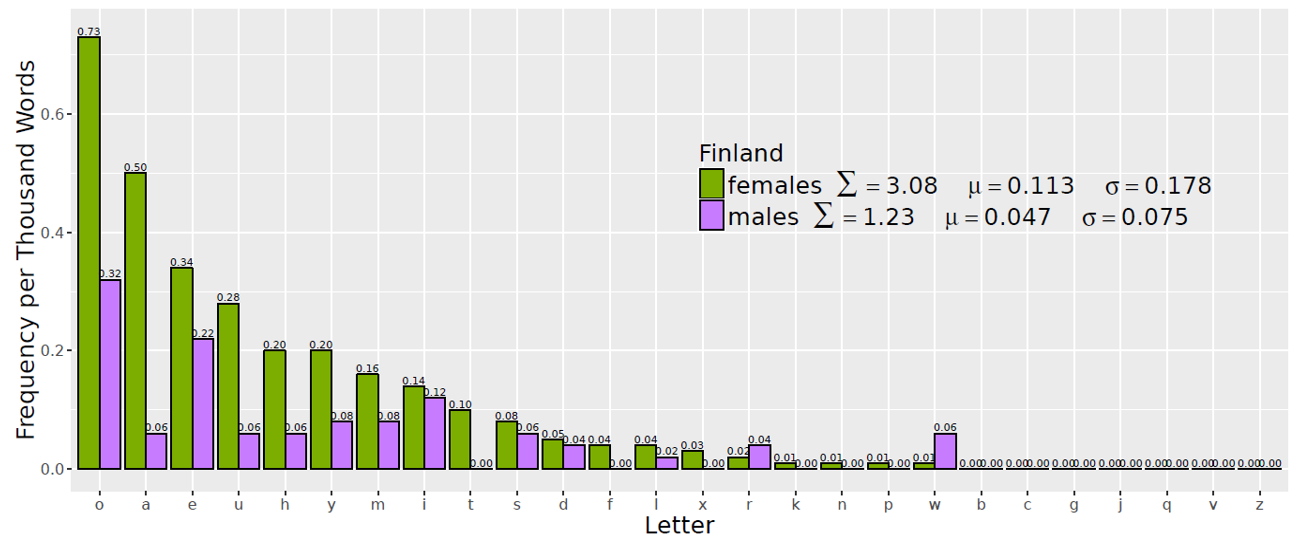
Figure 4. Expressive lengthening by repeated letter, Finland females and males.
For the US, differences were found among the most frequent types lengthened by males and females (Figure 5). The types ahhh, sooo, and soooo were among the 20 most frequent types used by both males and females. In addition, 12 lengthened pronounceable dictionary word forms were among the most lengthened types for females, as well as five pronounceable non-dictionary forms.
For males, only seven forms among the 20 most frequent correspond to dictionary words. The others include interjections and non-pronounceable non-dictionary words such as lmaooo, xxx, and afffffff (‘as fuck’).
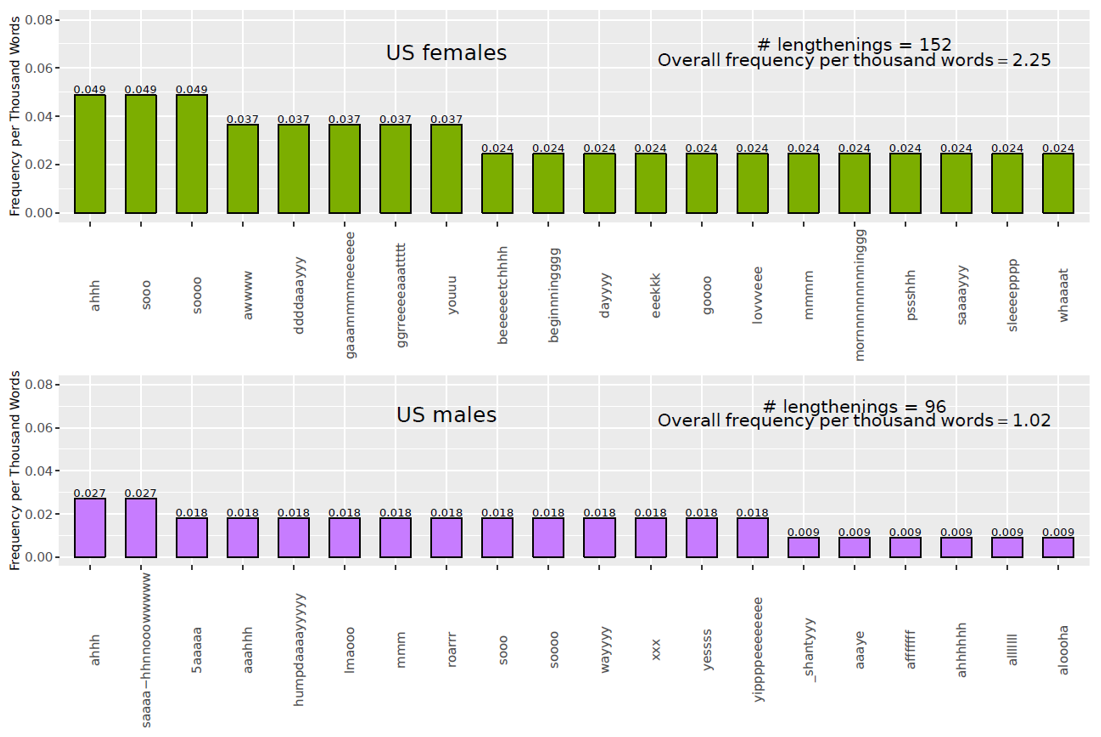
Figure 5. Twenty most frequent expressive lengthening types in the US by gender.
The letters lengthened by females and by males in the US data differ somewhat (Figure 6), but there is no clear gender-based association with a tendency to lengthen vowels or consonants. As the frequency profile suggests, the median of the differences between pairs is not zero for males and females. [22]
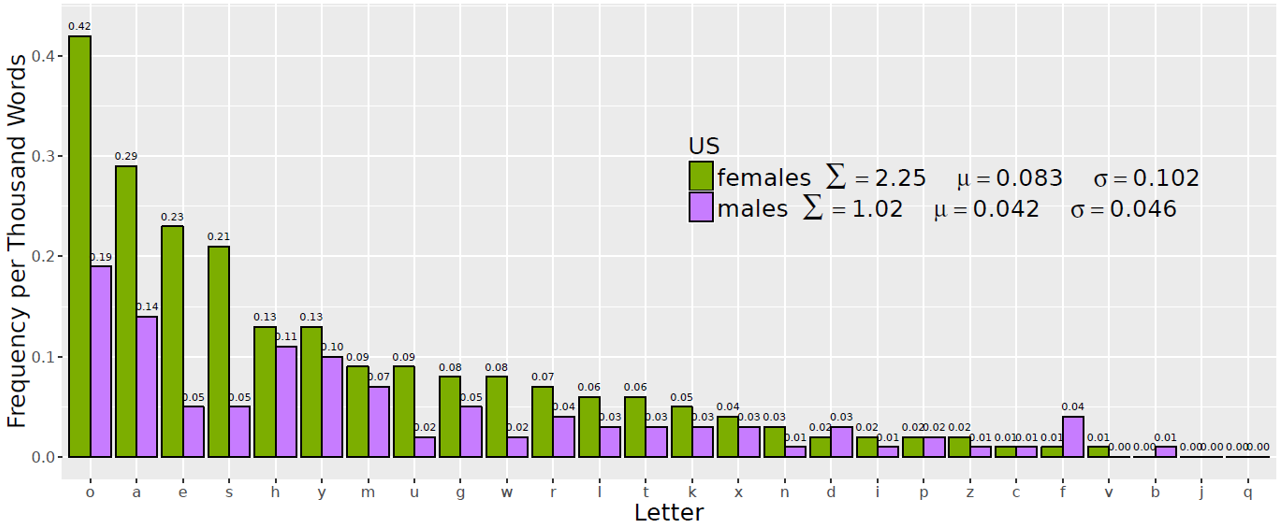
Figure 6. Expressive lengthening by repeated letter, US females and males.
Emoticons are sequences of text characters meant to represent facial expressions, gestures, or other embodied content pictorially, typically by using letter and punctuation characters from a standard character set (such as ASCII or ISO 8859-1). Although emoticons predate the use of computers, they are prevalent in certain genres of CMC (Hentschel 1998, Crystal 2006, Ptaszynski et al. 2011), including Twitter (Schnoebelen 2012b). [23] In some analyses of CMC emoticons have been interpreted as explicit affect indicators that convey contextual information corresponding to spoken-language cues such as prosodic, stress, and intonation features (e.g. Herring 1999, 2013), but they have also been considered to belong to a broader category of discourse organizers with little fixed affective content, used to position audiences around propositions (Schnoebelen 2012a, Vandergriff 2014). In general, emoticons are more frequently used by females in CMC and on Twitter (Baron 2004, Bamman, Eisenstein & Schnoebelen 2014), but emoticons associated with sarcasm, flirting behavior, or negative affect may be used more by males (Wolf 2000, Herring 2013).
In order to isolate emoticon types in the data, tokenization was undertaken utilizing a tokenizer and tagger sensitive to the non-standard orthography and punctuation typical of some Twitter messages: the Carnegie-Mellon University Twitter PoS Tagger (Gimpel et al. 2011, Gimpel et al. 2013, Owoputi et al. 2013). 113 types that unambiguously represent emoticons were identified from a larger set of more than 400 character strings tagged as emoticons in the data. Then, the log odds ratio θ statistic was calculated for each emoticon type from contingency tables with frequency counts of occurrence and non-occurrence for the groups to be compared. [24]
Although some work has been done associating particular emoticon types with affective states, for example by correlating them with the results of word-type-based sentiment analysis (Hogenboom et al. 2013) or by considering the facial expressions they represent from the perspective of kinesics (Ptaszynski et al. 2010 for “Eastern”-style emoticons), a categorical assignation of emoticon types to unique emotional states seems problematic, particularly in the context of work showing that emoticon types can have multiple discourse functions. For the ensuing interpretation of emoticon relative prevalence, the discussion of the sentiment associated with particular emoticons is based on a preliminary categorization of emoticon types as expressing positive or negative sentiment according to the orientation of the “mouth” element towards the “eye” element (following Ptaszynski et al. 2010: 1027): Types in which the mouth is represented as a concave shape as oriented toward the eyes are positive, whereas types with eyes and a convex mouth or eyes and a slanted mouth are negative (Table 10 row 1; see also Go, Bhayani & Huang 2009). A type representing a heart is positive, while a type representing a broken heart is negative. Types with expressive lengthening of the mouth component are interpreted according to the same principle. For emoticons rotated 90 degrees of the “Eastern” or kaomoji type (Ptaszynski et al. 2010, 2011), as in the second row in Table 10, types with carets or similar characters as eye elements are interpreted as positive, as is a type representing a torso with outstretched arms, while types with other eye forms are interpreted as negative.
| Positive emoticons | Negative emoticons |
|---|---|
| :) :-) =) :] :D :DDD XD (: (-: (= [: <3 | :( :-( =( :[ D: DDD: ): )-: )= ]: :/ \: </3 |
| ^^ ^_^ ^___^ \o/ | o.o o_o ._. -_- -___- >_< >.< T-T |
Table 10. Examples of positive and negative emoticons.
Overall, emoticons are more than five times more frequent in the Finland data (Table 11).
Some trends are evident when considering the emoticon types most overrepresented according to geographical location (Table 12). Finnish emoticon forms feature a <D> character (representing laughter) as the mouth element more frequently than do American forms, which tend to feature a smile character <)> (particularly in a repeated form). Among the most frequent types, emoticons that can be interpreted as corresponding to generally positive affective states (laughter, amusement, happiness) are slightly more common in the Finland data, with the eleven types :DD, :-D, xD, :D, ;)), =D, :’), ^^, ;D, xDD, and >:) compared to the seven types (‘:, <3<3<3<3<3, ^.^, :-))))), :)))))), :-)))), and <3<3<3<3. Negative emoticons, expressing sadness, incredulity, or boredom, are more common in the American data: nine types (/:, :\\, -_-, , =.=, 0_0, -,-, =(, ):, and O.o) are present among the 20 overrepresented types, compared to only four for the Finland data (</3, ._., ;^;, and o.O). The other types are somewhat more difficult to interpret, but among the Finnish data there are four types with “winking eyes” (;P, ;)), ;p, ;D): These have been interpreted in previous literature as indicative of flirting behavior (Herring 2013). As the low frequency values and corresponding significance levels obtained from calculating the p-values for Fisher’s exact test indicate, however, for many of the individual emoticon types, interpretation becomes problematic, particularly for the types overrepresented among US authors.
| Type | θ | Total freq | Freq Finland | Freq US | Sig. | Type | θ | Total freq | Freq Finland | Freq US | Sig. | |
|---|---|---|---|---|---|---|---|---|---|---|---|---|
| 1 | :DD | 3.20 | 26 | 26 | 0 | *** | /: | -2.99 | 4 | 0 | 4 | * |
| 2 | ;P | 3.08 | 23 | 23 | 0 | *** | (': | -2.74 | 3 | 0 | 3 | |
| 3 | :-D | 2.35 | 11 | 11 | 0 | * | <3<3<3<3<3 | -2.74 | 3 | 0 | 3 | |
| 4 | xD | 2.27 | 53 | 51 | 2 | *** | :\\ | -2.40 | 2 | 0 | 2 | |
| 5 | :O | 2.05 | 8 | 8 | 0 | -_- | -1.90 | 13 | 3 | 10 | ** | |
| 6 | :D | 2.00 | 220 | 206 | 14 | *** | ^.^ | -1.89 | 1 | 0 | 1 | |
| 7 | </3 | 1.78 | 6 | 6 | 0 | =.= | -1.89 | 1 | 0 | 1 | ||
| 8 | ;)) | 1.78 | 6 | 6 | 0 | 0_0 | -1.89 | 1 | 0 | 1 | ||
| 9 | ;p | 1.78 | 6 | 6 | 0 | :-))))) | -1.89 | 1 | 0 | 1 | ||
| 10 | =D | 1.61 | 5 | 5 | 0 | o: | -1.89 | 1 | 0 | 1 | ||
| 11 | :') | 1.46 | 25 | 23 | 2 | * | :)))))) | -1.89 | 1 | 0 | 1 | |
| 12 | :o | 1.41 | 4 | 4 | 0 | :-)))) | -1.89 | 1 | 0 | 1 | ||
| 13 | ._. | 1.41 | 4 | 4 | 0 | -,- | -1.89 | 1 | 0 | 1 | ||
| 14 | ^^ | 1.22 | 20 | 18 | 2 | <3<3<3<3 | -1.89 | 1 | 0 | 1 | ||
| 15 | ;D | 1.16 | 11 | 10 | 1 | :-P | -1.89 | 1 | 0 | 1 | ||
| 16 | xDD | 1.16 | 3 | 3 | 0 | =( | -1.64 | 4 | 1 | 3 | ||
| 17 | >:) | 1.16 | 3 | 3 | 0 | :-) | -1.59 | 123 | 41 | 82 | *** | |
| 18 | ;^; | 1.16 | 3 | 3 | 0 | ): | -1.57 | 88 | 29 | 59 | *** | |
| 19 | o.O | 1.16 | 3 | 3 | 0 | (: | -1.38 | 28 | 10 | 18 | *** | |
| 20 | :3 | 1.03 | 45 | 39 | 6 | ** | O.o | -1.30 | 3 | 1 | 2 | |
Significance (Fisher’s exact test p-value): * < 0.05, ** < 0.01, *** < 0.001 |
||||||||||||
Table 12. Most Finnish and American emoticons.
There was also a wide discrepancy in emoticon use according to subcorpus gender: The Finland female subcorpus exhibited a rate of emoticon use more than three times that of the Finland male subcorpus. The US subcorpora exhibited much lower rates of emoticon use, but also here females used emoticons at a rate of more than 1.5 that of males (Table 13).
| Corpus | Emoticons/1000 tokens |
|---|---|
| Finland Female | 11.79 |
| Finland Male | 3.41 |
| US Female | 1.62 |
| US Male | 1.06 |
Table 13. Emoticon frequency by gender.
The mean aggregate values for the gendered subcorpora reflect the highly skewed distribution of emoticon use – a few authors in the data use emoticons extensively, while most authors use them rarely or not at all. If the same data is considered from the point of view of individual users (Table 13a), the gender-based discrepancy is reduced somewhat for the Finland data, but females remain much more enthusiastic users of emoticons overall.
| Corpus | Emoticons/1000 tokens | St.d. |
|---|---|---|
| Finland Female | 6.32 | 29.79 |
| Finland Male | 3.21 | 17.69 |
| US Female | 2.16 | 17.12 |
| US Male | 0.94 | 9.13 |
Table 13a. Mean emoticon frequency by unique user and standard deviation.
Comparing the emoticon types overrepresented within the male- and female-gendered Finland English data (Table 14), emotional affect seems unequally distributed in terms of emoticon use: Among the most “female” types are eleven positive emoticons (:’), xD, :-D, :DD, (:, :D, :)), <333, =), xDD, and xd) and four negative ():, </3, D:,and ]:). Males are more likely to utilize emoticons associated with negative affect: Among the 20 most overrepresented types are five positive emoticons (;))), (=, XDDD, XD, and ^_^) and nine negative (;-;, ;__;, ;___;, .__., D;, :-(, ;_;, :((, and ._.) Males in the Finland data are also much more likely to employ “Eastern”, or kaomoji emoticons, with seven such forms among the twenty most overrepresented, compared to zero for females. As above, however, many of the frequency differences do not achieve significance according to Fisher’s exact test due to low overall frequencies.
| Type | θ | Total freq | Freq female | Freq male | Sig. | Type | θ | Total freq | Freq female | Freq male | Sig. | |
|---|---|---|---|---|---|---|---|---|---|---|---|---|
| 1 | ): | 3.64 | 24 | 24 | 0 | *** | ;-; | -1.86 | 2 | 0 | 2 | |
| 2 | ;P | 3.60 | 23 | 23 | 0 | *** | ;))) | -1.35 | 1 | 0 | 1 | |
| 3 | :') | 3.55 | 22 | 22 | 0 | *** | ;__; | -1.35 | 1 | 0 | 1 | |
| 4 | xD | 3.22 | 48 | 49 | 1 | *** | ;____; | -1.35 | 1 | 0 | 1 | |
| 5 | :-D | 2.79 | 10 | 10 | 0 | ** | .___. | -1.35 | 1 | 0 | 1 | |
| 6 | :p | 2.73 | 29 | 30 | 1 | *** | :333 | -1.35 | 1 | 0 | 1 | |
| 7 | :O | 2.58 | 8 | 8 | 0 | * | D; | -1.35 | 1 | 0 | 1 | |
| 8 | :DD | 2.54 | 24 | 25 | 1 | *** | (= | -1.35 | 1 | 0 | 1 | |
| 9 | </3 | 2.31 | 6 | 6 | 0 | XDDD | -1.35 | 1 | 0 | 1 | ||
| 10 | ;p | 2.31 | 6 | 6 | 0 | XD | -1.22 | 19 | 5 | 14 | * | |
| 11 | (: | 2.15 | 5 | 5 | 0 | :-( | -0.76 | 3 | 1 | 2 | ||
| 12 | D: | 2.15 | 5 | 5 | 0 | ;_; | -0.76 | 3 | 1 | 2 | ||
| 13 | :D | 2.10 | 172 | 188 | 16 | *** | ^_^ | -0.25 | 6 | 3 | 3 | |
| 14 | :)) | 1.94 | 13 | 14 | 1 | ** | :(( | -0.25 | 4 | 2 | 2 | |
| 15 | ]: | 1.94 | 4 | 4 | 0 | ._. | -0.25 | 2 | 1 | 1 | ||
| 16 | <333 | 1.69 | 3 | 3 | 0 | |||||||
| 17 | :o | 1.69 | 3 | 3 | 0 | |||||||
| 18 | =) | 1.69 | 3 | 3 | 0 | |||||||
| 19 | xDD | 1.69 | 3 | 3 | 0 | |||||||
| 20 | xd | 1.69 | 3 | 3 | 0 | |||||||
Significance (Fisher’s exact test p-value): * < 0.05, ** < 0.01, *** < 0.001 |
||||||||||||
Table 14. Most female and male emoticons, Finland.
The US emoticon data (Table 15) shows a similar pattern: Among the more “female” types, positive emoticons are more common than among the “male” types, with thirteen (:)))), XD, :’), :-)), :))))))), =), ;))), :-)))), :), ;), (:, ;-), and :D) compared to eight (:)), :))), (‘:, xD, :-))))), :)))))), :-), ^_^). Negative emoticons are slightly overrepresented amongst males, with six types (:-(, /:, ]:, o_O, :((((, and -_-) compared to five for females (-.-, .__., >:(, ;-;, and -,-) in the top twenty. Due to the low overall frequencies of emoticon use in the gendered US data, however, significance is achieved according to Fisher’s exact test for only one emoticon type: Females use the “noseless smiley” (:)) more than males.
| Type | θ | Total freq | Freq female | Freq male | Sig. | Type | θ | Total freq | Freq female | Freq male | Sig. | |
|---|---|---|---|---|---|---|---|---|---|---|---|---|
| 1 | :)))) | 1.93 | 2 | 2 | 0 | :p | -2.08 | 5 | 0 | 5 | ||
| 2 | XD | 1.93 | 2 | 2 | 0 | :3 | -1.63 | 3 | 0 | 3 | ||
| 3 | -.- | 1.93 | 2 | 2 | 0 | :-( | -1.29 | 2 | 0 | 2 | ||
| 4 | :') | 1.93 | 2 | 2 | 0 | :)) | -0.98 | 6 | 1 | 5 | ||
| 5 | .__. | 1.42 | 1 | 1 | 0 | :))) | -0.78 | 5 | 1 | 4 | ||
| 6 | >:( | 1.42 | 1 | 1 | 0 | /: | -0.78 | 1 | 0 | 1 | ||
| 7 | ;-; | 1.42 | 1 | 1 | 0 | (': | -0.78 | 1 | 0 | 1 | ||
| 8 | :-)) | 1.42 | 1 | 1 | 0 | ]: | -0.78 | 1 | 0 | 1 | ||
| 9 | :))))))) | 1.42 | 1 | 1 | 0 | xD | -0.78 | 1 | 0 | 1 | ||
| 10 | =) | 1.42 | 1 | 1 | 0 | o_O | -0.78 | 1 | 0 | 1 | ||
| 11 | o: | 1.42 | 1 | 1 | 0 | :(((( | -0.78 | 1 | 0 | 1 | ||
| 12 | ;))) | 1.42 | 1 | 1 | 0 | :-))))) | -0.78 | 1 | 0 | 1 | ||
| 13 | :-)))) | 1.42 | 1 | 1 | 0 | :)))))) | -0.78 | 1 | 0 | 1 | ||
| 14 | -,- | 1.42 | 1 | 1 | 0 | ^^ | -0.78 | 1 | 0 | 1 | ||
| 15 | :-P | 1.42 | 1 | 1 | 0 | :-) | -0.54 | 41 | 12 | 29 | ||
| 16 | :) | 0.94 | 89 | 58 | 31 | *** | ^_^ | -0.19 | 3 | 1 | 2 | |
| 17 | ;) | 0.85 | 22 | 14 | 8 | -_- | -0.02 | 5 | 2 | 3 | ||
| 18 | (: | 0.83 | 11 | 7 | 4 | |||||||
| 19 | ;-) | 0.83 | 11 | 7 | 4 | |||||||
| 20 | :D | 0.83 | 3 | 2 | 1 | |||||||
Significance (Fisher’s exact test p-value): * < 0.05, ** < 0.01, *** < 0.001 |
||||||||||||
Table 15. Most female and male emoticons, US.
For the US and Finland corpora, types with high relative lexical frequencies may reflect immediate local circumstances: Even in a virtual context, users will tend to discuss concerns such as the places where they are located (Starbucks, particular US states or Senate Square in Helsinki), where they plan to go (for Finnish users, London), or other local circumstances (beaches and islands in the US or freezing weather in Finland).
Gender differences similar to those found in some previous studies are manifest in the most frequent types used by males and females. Females tend to use more word types associated with emotional affect and the negotiation of interpersonal concerns (Rao et al. 2010, Burger et al. 2011), whereas males use word types associated with information, especially technology, sports, and beer (Rao et al. 2010, Bamman, Eisenstein & Schnoebelen 2014).
Expressive lengthening, or repetition of characters within word forms, is more prevalent in the data from Finland than from the US, and the feature is much more commonly used by females than by males. This supports findings from previous studies (Rao et al. 2010, Bamman, Eisenstein & Schnoebelen 2014). Compared to previous studies, lengthening is much more common in the present data: For example, Riordan & Kreuz (2010: 1809) found 0.156 word tokens per thousand were lengthened. Kalman & Gergle (2014: 192) reported lengthening in terms of occurrences per total number of characters (not tokens), but found that in their data, lengthening occurred at a rate of 13% of that reported by Riordan & Kreuz. These rates are much lower than that of the present data set. The reason for the difference is not known, but genre could play a role: Riordan & Kreuz’s data consisted mainly of emails, which may exhibit more formal features than genres such as chat or Twitter. Kalman & Gergle’s data consisted of work-related emails produced in the mid- to late 1990s.
Schnoebelen (2012b: 197–199, 221), considering co-occurrences of lengthenings and emoticons in individual tweets, found a rate of 0.212 lengthenings per thousand tokens in a 21m word corpus of American English tweets collected in 2011. The overall rate of lengthenings in all tweets, however, was not considered.
Processing procedures may also play a role: Kalman & Gergle, for example, only considered lengthening in tokens whose roots correspond to dictionary words (i.e. not non-standard words or sequences of punctuation, as in the present study), while the exact criteria for the classification of a type as representing a lengthening were not made explicit by Riordan & Kreuz or by Schnoebelen. It may also be the case, as suggested by Kalman & Gergle (2014: 192), that the feature is increasing in use over time and is more common now than in the 1990s, 2000s, or 2011.
Several of the word types most frequently lengthened in the US data in this study correspond directly to frequently lengthened word types found by Kalman & Gergle (2014: 191). In our data, as in the data of Riordan & Kreuz and Kalman & Gergle, vowels are much more likely to be lengthened than are consonants, with <o> the most common lengthening target. An interesting avenue for further research would be to investigate the modalities of this patterning – for example, whether L1 phonological considerations such as relative phoneme frequencies in spoken language affect lengthening in English text production.
As for gender differences in expressive lengthening, in Finland interactive/affective types such as initialisms and emoticons figure among the most frequent lengthened types, and users in Finland with female induced gender are more likely to lengthen word types associated with emotional affect such as profanity or politeness markers. [25] Finnish males are more likely to lengthen named entities and adjectives or nouns. The US gendered data for expressive lengthening, however, is more ambiguous.
Finnish Twitter users writing in English use far more emoticons than do US-based users: particularly Finnish females make frequent use of this expressive resource. Finland-based users seem more likely to use types that can be associated with positive affect according to a preliminary classification scheme. Females, in both Finland and the US, tend to use more positive affect emoticons, whereas males use more emoticons expressing negative affective orientation. This is, once again, in line with previous findings from other contexts (e.g. Herring 2013).
Although the emoticon data seems to support some previous findings pertaining to gender and emoticon use, the interpretations must remain preliminary at this point, due to the low frequency counts of these types. Continued analysis along these lines will necessitate larger corpora and may benefit from bootstrapping, resampling, or other methods that can be used to reliably compare count data in corpora of different sizes (see e.g. Lijffijt et al. 2016).
In the context of an increasing online diversification of English, Twitter discourse in Finland, as it is manifest in the relative frequencies of lexical items and non-standard features such as expressive lengthening and emoticons, reflects the fact that users are bound to local entities while at the same time they engage with global cultural trends.
Some of the findings from previous research pertaining to the use of language and gender seem confirmed by the results from this study: Females may use word forms and lexical types that are associated with interaction and the negotiation of interpersonal concerns, such as affect markers, more than males, and females use non-standard affective features such as expressive lengthening and emoticons much more extensively than do males, especially in Finland. To a certain extent this is unsurprising: a central tenet of variationist sociolinguistics posits that although males use more non-standard linguistic forms in stable language situations, females are often quicker to embrace new linguistic forms when they are introduced into a community from social groups perceived to have high social standing (Labov 2001: 266). In a dynamic environment in which English plays an increasing role in daily online communication, it is feasible to interpret high rates of use of non-standard features by females in Finland as openness to what is perceived to be an Anglophone global culture.
The other aspect of gender- or sex-based difference in language as it is manifest in English used on Twitter in Finland may not reflect the changing language environment, but rather different orientations among males and females towards the use of communicative functions that relate to categories such as affect maintenance or solidarity (Holmes 1998). Such a suggestion is controversial, and while it is beyond the scope of this paper to speculate on the matter, it could seem surprising that messages from the Finland data, many of whose authors presumably have Finnish as an L1 (a language that lacks the grammatical category of gender and whose users are presumably less prone to the reification of the categories of biological and grammatical gender), would exhibit tendencies similar to those of English L1 users of language when writing in English.
Future research using larger, more representative corpora could explore such questions, perhaps also from a comparative perspective focused not only on online use of English. Typological considerations would undoubtedly contribute to a better understanding of the ways in which English continues to evolve as it is used in global digital contexts.
[1] JavaScript Object Notation: an open-standard data format for interaction between webpages and servers. [Go back up]
[2] https://support.twitter.com/articles/122236 [Go back up]
[3] Much of the literature is referenced in Leppänen et al. (2011). [Go back up]
[4] http://www.gadm.org, the procedure was carried out in R using the packages {maps}, {mapdata}, {maptools}, {rgdal}, and {rgeos}. As noted above, the value in the “location” attribute of the “user” entity can be unreliable. [Go back up]
[5] Tweet entities contains an attribute whose value indicates the automatically-detected language of the status update since mid-2013. However, Twitter has not made public the algorithm by which language is detected nor reported on its accuracy – the method presumably uses probabilistic Bayes classification based on character n-gram frequencies in training data. Extremely short tweets, and tweets that consist of language mixtures, tend to be assigned the language label ‘und’ (undetected). See https://blog.twitter.com/2013/introducing-new-metadata-for-tweets [Go back up]
[6] This corresponds to the names of 2,642,743 males and 2,769,142 females; the 800 most common names represent 97% of all given male names and 94% of all given female names in the Finnish population as of 2014. [Go back up]
[7] This corresponds to the names of 113,357,536 males and 104,963,698 females; the 800 most common names represent 91% of all given male names and 82% of all given female names in the time period. Mislove et al. (2011: 556) report a similar overrepresentation of male names in their matches. The reason for the greater diversity of female given names is unknown. [Go back up]
[8] This was done with regular expressions; the match pattern found all names in which the search string occurred either at the beginning of the string or separated by a space within the string. The search string could also be followed by non-alphabetic characters. Thus, for example, the (fictitious) author_names “James”, “James Smith”, or “Mr. James100” would match for the name James, whereas “Jamesy” would not. [Go back up]
[9] There are limitations associated with this method – not only will not all persons bearing a certain name will be of the same gender (names that matched both genders were filtered out, however), but not every user will select an “author_name” that corresponds to their gender, however they may choose to define it. For the most part, however, it will be safe to assume that (e.g.) the overwhelming majority of persons named Michael in the United States are male or Tuula in Finland are female. [Go back up]
[10] This effect was significant according to a chi-squared test (p-value < 0.001). [Go back up]
[11] A difference between the US users writing in English and US users overall was not significant by gender according to a chi-squared test (p-value = 0.57). [Go back up]
[12] The hashtag has, however, taken on additional, pragmatic functions in Twitter discourse (see Zappavigna 2011, Page 2012, Wikström 2014, Squires 2015). [Go back up]
[13] Pearson’s chi-squared test of independence found that p < 0.001 for the Finland-US difference for both usernames and hashtags. [Go back up]
[14] p < 0.001 for all of these differences. [Go back up]
[15] This method was chosen rather than a raw frequency count of the number of occurrences of each word type, as it is less likely to result in values skewed by the activity of one or a handful of extremely active users. [Go back up]
[16] Significant according to the results of a chi-squared test (p = 0.005). [Go back up]
[17] Cursory examination of the content of the Finland-based tweets suggests this may be the case – a significant proportion of the discourse represents attempts to interact with Anglophone popular entertainers who appeal mainly to younger demographic groups. [Go back up]
[18] More commonly encountered in majuscule characters; the frequencies here were calculated after normalizing by converting to lower case. The distinction between dictionary words, pronounceable non-dictionary words, and non-pronounceable non-dictionary words is made by Bamman, Eisenstein & Schnoebelen (2014). [Go back up]
[19] The median of the relative frequency differences per letter was approximately zero for Finland and the US according to a Wilcoxon signed-rank test (V = 206.5, p-value = 0.2418). [Go back up]
[20] Significant according to Pearson’s chi-squared test of independence: Finland p < 0.001, US p < 0.001. [Go back up]
[21] According to a Wilcoxon signed-rank test (V = 172.5, p-value = 0.001934). [Go back up]
[22] According to a Wilcoxon signed-rank test (V = 235.5, p-value = 0.000416). [Go back up]
[23] In this analysis emojis, or image characters with dedicated Unicode code points mainly outside of the Unicode Basic Multilingual Plane (Davis & Edberg 2015), are not considered. [Go back up]
[24] This procedure is different from the one described above for lexical types, as it calculates the statistic on the basis of type frequency counts, not the proportion of unique users utilizing the type. It was found that due to the low overall frequency of emoticon types in the corpora and the overwhelming overrepresentation of emoticons in the Finland data, log-odds ratios of user proportions were uninformative for most emoticon types. Calculating the statistic based on frequency counts, however, may run the risk of results being skewed by individual users. [Go back up]
[25] Politeness markers have been associated with female language in previous research, but profanity is usually associated with male authors. See e.g. Newman et al. (2008). [Go back up]
Agresti, Alan. 2002. Categorical Data Analysis, 2nd edition. New York: John Wiley.
Argamon, Shlomo, Moshe Koppel, James Pennebaker & Jonathan Schler. 2007. “Mining the blogosphere: Age, gender, and the varieties of self-expression”. First Monday 12(9). http://firstmonday.org/ojs/index.php/fm/article/view/2003/1878
Bamman, David, Jacob Eisenstein & Tyler Schnoebelen. 2014. “Gender identity and lexical variation in social media”. Journal of Sociolinguistics 18: 135–60.
Baron, Naomi. 2004. “See you online: Gender issues in college student use of instant messaging”. Journal of Language and Social Psychology 23: 397–423.
Blommaert, Jan. 2012. “Supervernaculars and their dialects”. Dutch Journal of Applied Linguistics 1(1): 1–14.
Burger, John D., John Henderson, George Kim & Guido Zarrella. 2011. “Discriminating gender on Twitter”. Proceedings of the Conference on Empirical Methods in Natural Language Processing (EMNLP), 1301–1309. Stroudsburg, PA: Association for Computational Linguistics. http://www.aclweb.org/anthology/D11-1120
Cheshire, Jenny. 2002. “Sex and gender in variationist research”. The Handbook of Language Variation and Change, ed. by J.K. Chambers, Peter Trudgill & Natalie Schilling-Estes, 423–444. Malden, MA: Blackwell.
Coats, Steven. 2016. “Grammatical feature frequencies of English on Twitter in Finland”. English in Computer-mediated Communication: Variation, Representation, and Change, ed. by Lauren Squires, 179–210. Berlin: De Gruyter.
Crystal, David. 2006. Language and the Internet, 2nd ed. Cambridge, UK: Cambridge University Press.
Davis, Mark & Peter Edberg. 2015. “Unicode emoji”. Unicode Technical Report 51. Mountain View, CA: Unicode Consortium. http://unicode.org/reports/tr51
Dunning, Ted. 1993. “Accurate methods for the statistics of surprise and coincidence”. Computational Linguistics 19: 61–74.
Eisenstein, Jacob, Brendan O’Connor, Noah A. Smith & Eric P. Xing. 2014. “Diffusion of lexical change in social media”. PLoS ONE 9(11). doi:10.1371/journal.pone.0113114
Evert, Stefan. 2004. The Statistics of Word Cooccurrences: Word Pairs and Collocations. Ph.D. Thesis, University of Stuttgart, Stuttgart, Germany.
Evert, Stefan. 2012. “corpora: Statistics and data sets for corpus frequency data”. R package version 0.4-3. https://CRAN.R-project.org/package=corpora
Evert, Stefan & Marco Baroni. 2008. “Statistical methods for corpus exploration”. Corpus Linguistics, Vol. 2, ed. by Anke Lüdeling & Merja Kytö, 777–803. Berlin: De Gruyter.
Fry, Dennis. 1955. “Duration and intensity as physical correlates of linguistic stress”. Journal of the Acoustic Society of America 27: 765–768.
Gimpel, Kevin, Nathan Schneider, Brendan O’Connor, Dipanjan Das, Daniel Mills, Jacob Eisenstein, Michael Heilman, Dani Yogatama, Jeffrey Flanigan & Noah A. Smith. 2011. “Part-of-speech tagging for Twitter: Annotation, features, and experiments”. Proceedings of the 49th Annual Meeting of the Association for Computational Linguistics: Human Language Technologies, 42–47. Stroudsburg, PA: Association for Computational Linguistics. http://dl.acm.org/citation.cfm?id=2002736.2002747
Gimpel, Kevin, Nathan Schneider & Brendan O’Connor. 2013. “Annotation guidelines for Twitter part-of-speech tagging version 0.3”. Pittsburgh, PA: Computational Science Department, Carnegie Mellon University. http://www.ark.cs.cmu.edu/TweetNLP/annot_guidelines.pdf
Go, Alec, Richa Bhayani & Lei Huang. 2009. “Twitter sentiment classification using distant supervision”. Stanford, CA: Stanford University CS224N Project Report. http://www-cs.stanford.edu/people/alecmgo/papers/TwitterDistantSupervision09.pdf
Hentschel, Elke. 1998. “Communication on IRC”. Linguistik Online 1. http://www.linguistik-online.com/irc.htm
Herring, Susan. 1999. “Interactional coherence in CMC”. Journal of Computer-Mediated Communication 4(4). doi:10.1111/j.1083-6101.1999.tb00106.x
Herring, Susan. 2013. “Discourse in Web 2.0: Familiar, reconfigured, and emergent”. Discourse 2.0: Language and New Media, ed. by Deborah Tannen & Anna Marie Trester, 1–25. Washington, DC: Georgetown University Press.
Heyd, Theresa & Christian Mair. 2014. “From vernacular to digital ethnolinguistic repertoire: The case of Nigerian Pidgin”. Indexing Authenticity: Perspectives from Linguistics and Anthropology, ed. by Véronique Lacoste, Jakob Leimgruber & Thiemo Breyer, 242–266. Boston & Berlin: De Gruyter.
Hinrichs, Lars. 2006. Code-switching on the Web: English and Jamaican Creole in E-mail Communication. Amsterdam: Benjamins.
Hogenboom, Alexander, Daniela Bal, Flavius Frasincar, Malissa Bal, Franciska de Jong & Uzay Kaymak. 2013. “Exploiting emoticons in sentiment analysis”. Proceedings of the 28th Annual ACM Symposium, 703–710. New York: Association for Computing Machinery. doi:10.1145/2480362.2480498
Holmes, Janet. 1998. “Women’s talk: The question of qociolinguistic universals”. Language and Gender: A Reader, ed. by Jennifer Coates, 461–483. Oxford: Oxford University Press.
Honeycutt, Courtenay & Susan Herring. 2009. “Beyond microblogging: Conversation and collaboration via Twitter”. System Sciences (HICSS) 42: 1–10. doi:10.1109/HICSS.2009.89, http://ella.slis.indiana.edu/~herring/honeycutt.herring.2009.pdf
Jaffe, Alexandra, Jannis Androutsopoulos, Mark Sebba & Sally Johnson, eds. 2012. Orthography as Social Action: Scripts, Spelling, Identity and Power. Boston & Berlin: De Gruyter.
Kachru, Braj. 1992. The Other Tongue: English across Cultures. Urbana, IL: University of Illinois Press.
Kalman, Yoram & Darren Gergle. 2014. “Letter repetitions in computer mediated communication: A unique link between spoken and online language”. Computers in Human Behavior 34, 187–193.
Kilgarriff, Adam. 2001. “Comparing corpora”. International Journal of Corpus Linguistics 6(1): 1–37.
Klatt, Dennis. 1976. “Linguistic uses of segmental duration in English: Acoustic and perceptual evidence”. Journal of the Acoustic Society of America 59: 1208–1221.
Kretzschmar, William. 2009. The Linguistics of Speech. Cambridge, UK: Cambridge University Press.
Kytölä, Samu. 2012. “Peer normativity and sanctioning of linguistic resources-in-use: On non-standard Englishes in Finnish football forums online”. Dangerous Multilingualism: Northern Perspectives on Order, Purity and Normality, ed. by Jan Blommaert, Sirpa Leppänen, Päivi Pahta & Tiina Räisänen, 228–260. Basingstoke: Palgrave Macmillan.
Kytölä, Samu. 2014. “Polylingual language use, framing and entextualization in digital discourse: Pseudonyms and ‘Signatures’ on two Finnish online football forums”. Texts and Discourses of New Media (Studies in Variation, Contacts and Change in English 15), ed. by Jukka Tyrkkö & Sirpa Leppänen. Helsinki: VARIENG. http://www.helsinki.fi/varieng/series/volumes/15/kytola/
Kytölä, Samu & Elina Westinen. 2015. “’I be da reel gansta’ — A Finnish footballer’s Twitter writing and metapragmatic evaluations of authenticity”. Discourse, Context & Media 8: 6–19.
Labov, William. 2001. Principles of Linguistic Change, Vol. 2: Social Factors. Oxford: Blackwell.
Laitinen, Mikko. 2010. “Describing ‘orderly differentiation’: Compiling the Corpus of English in Finland”. English Today 26(1): 228–260.
Laitinen, Mikko. 2011. “Contacts and variability in international Englishes: Compiling and using the Corpus of English in Finland”. Methodological and Historical Dimensions of Corpus Linguistics (Studies in Variation, Contacts and Change in English 6), ed. by Paul Rayson, Sebastian Hoffmann & Geoffrey Leech. Helsinki: VARIENG. http://www.helsinki.fi/varieng/series/volumes/06/laitinen/
Leetaru, Kalev H., Shaowen Wang, Guofeng Cao, Anand Padmanabhan & Eric Shook. 2013. “Mapping the global Twitter heartbeat: The geography of Twitter”. First Monday 18(5). http://firstmonday.org/ojs/index.php/fm/article/view/4366/3654
Leppänen, Sirpa. 2007. “Youth language in media contexts: Insights into the functions of English in Finland”. World Englishes 26(2): 149–169.
Leppänen, Sirpa, Anne Pitkänen-Huhta, Arja Piirainen-Marsh, Tarja Nikula & Saija Peuronen. 2009. “Young people’s translocal new media uses: A multiperspective analysis of language choice and heteroglossia”. Journal of Computer-Mediated Communication 14(4): 1080–1107.
Leppänen, Sirpa, Anne Pitkänen-Huhta, Tarja Nikula, Samu Kytölä, Timo Törmäkangas, Kari Nissinen, Leila Kääntä, Tiina Räisänen, Mikko Laitinen, Heidi Koskela, Salla Lähdesmäki & Henna Jousmäki. 2011. National Survey on the English Language in Finland: Uses, meanings and attitudes (Studies in Variation, Contacts and Change in English 5). Helsinki: VARIENG. http://www.helsinki.fi/varieng/series/volumes/05/
Lijffijt, Jefrey, Terttu Nevalainen, Tanja Säily, Panagiotis Papapetrou, Kai Puolamäki & Heikki Mannila. 2016. “Significance testing of word frequencies in corpora”. Digital Scholarship in the Humanities 31(2): 374–397.
Ling, Rich. 2005. “An analysis of SMS use by a random sample of Norwegians”. Mobile Communications: Renegotiation of the Social Sphere, ed. by Rich Ling & Per Pedersen, 335–349. London: Springer.
Mauranen, Anna. 2010. “Features of English as a lingua franca in academia”. Helsinki English Studies 6: 6–28.
Mauranen, Anna & Elina Ranta. 2008. “English as an academic lingua franca – The ELFA project”. Nordic Journal of English Studies 7(3): 199–202.
Mislove, Alan, Sune Lehmann, Yong-Yeol Ahn, Jukka-Pekka Onnela & J. Niels Rosenquist. 2011. “Understanding the demographics of Twitter users”. Proceedings of the Fifth International AAAI Conference on Weblogs and Social Media, 554–557. Menlo Park, CA: AAAI. http://www.aaai.org/ocs/index.php/ICWSM/ICWSM11/paper/view/2816/3234
Mocanu, Delia, Andrea Baronchelli, Nicola Perra, Bruno Gonçalves, Qian Zhang & Alessandro Vespignani. 2013. “The Twitter of Babel: Mapping world languages through microblogging platforms”. PLoS ONE 8(4): e61981. doi:10.1371/journal.pone.0061981
Morstatter, Fred, Jürgen Pfeffer, Huan Liu & Kathleen M. Carley. 2013. “Is the sample good enough? Comparing data from Twitter's streaming API with Twitter's firehose”. Association for the Advancement of Artificial Intelligence International Conference on Weblogs and Social Media (AAAI-ICWSM 2013) 7: 400–408. https://www.aaai.org/ocs/index.php/ICWSM/ICWSM13/paper/view/6071
Newman, Matthew, Carla Groom, Lori Handelman & James Pennebaker. 2008. “Gender differences in language use: An analysis of 14,000 text samples”. Discourse Processes 45: 211–236.
Owoputi, Olutobi, Brendan O’Connor, Chris Dyer, Kevin Gimpel, Nathan Schneider & Noah A. Smith. 2013. “Improved part-of-speech tagging for online conversational text with word clusters”. Proceedings of NAACL-HLT, 380–390. Stroudsburg, PA: Association for Computational Linguistics. http://www.aclweb.org/anthology/N13-1039
Page, Ruth. 2012. “The linguistics of self-branding and micro-celebrity in Twitter: The role of hashtags”. Discourse & Communication 6(2): 181–201.
Paolillo, John. 2001. “Language variation on Internet Relay Chat: A social network approach”. Journal of Sociolinguistics 5(2): 180–213.
Paquot, Magali & Yves Bestgen. 2009. “Distinctive words in academic writing: a comparison of three statistical tests for keyword extraction”. Corpora: Pragmatics and Discourse, ed. by Andreas Jucker, Daniel Schreier & Marianne Hundt, 247–269. Amsterdam: Rodopi.
Pavalanathan, Umashanthi & Jacob Eisenstein. 2015. “Confounds and consequences in geotagged Twitter data”. Proceedings of the 2015 Conference on Empirical Methods in Natural Language Processing, 2138–2148. http://aclweb.org/anthology/D15-1256
Piantadosi, Steven, Harry Tily & Edward Gibson. 2011. “Word lengths are optimized for efficient communication”. Proceedings of the National Academy of Sciences of the USA 108(9): 3526–3529. doi:10.1073/pnas.1012551108
Ptaszynski, Michal, Jacek Maciejewski, Pawel Dybala, Rafal Rzepka & Kenji Araki. 2010. “CAO: A fully automatic emoticon analysis system”. Proceedings of the Twenty-Fourth AAAI Conference on Artificial Intelligence (AAAI-10), 1026–1032. Palo Alto, CA: Association for the Advancement of Artificial Intelligence. https://www.aaai.org/ocs/index.php/AAAI/AAAI10/paper/view/1828
Ptaszynski, Michal, Rafal Rzepka, Kenji Araki & Yoshio Momouchi. 2011. “Research on emoticons: Review of the field and proposal of research framework”. Proceedings of the Seventeenth Annual Meeting of the Association for Natural Language Processing (NLP-2011), 1159–1162. Toyohashi, Japan: Association for Natural Language Processing. http://arakilab.media.eng.hokudai.ac.jp/~ptaszynski/data/E5-6.pdf
Rao, Delip, David Yarowsky, Abhishek Shreevats & Manaswi Gupta. 2010. “Classifying latent user attributes in Twitter”. Proceedings of the 2nd International Workshop on Search and Mining User-Generated Contents, 37–44. New York: Association for Computing Machinery. doi:10.1145/1871985.1871993
Riordan, Monika A. & Roger J. Kreuz. 2010. “Cues in computer-mediated communication: A corpus analysis”. Computers in Human Behavior 26(6): 1806–1817.
Schnoebelen, Tyler. 2012a. “Do you smile with your nose? Stylistic variation in Twitter emoticons”. University of Pennsylvania Working Papers in Linguistics 18(2): 115–125. http://repository.upenn.edu/pwpl/vol18/iss2/14
Schnoebelen, Tyler. 2012b. Emotions are Relational: Positioning and the Use of Affective Linguistic Resources. Ph.D. Thesis, Stanford University, Stanford, CA.
Sebba, Mark. 2007. Spelling and Society: The Culture and Politics of Orthography around the World. Cambridge, UK: Cambridge University Press.
Squires, Lauren. 2012. “Whos punctuating what? Sociolinguistic variation in instant messaging”. In Jaffe, Androutsopoulos, Sebba & Johnson (eds.), 289–324.
Squires, Lauren. 2015. “Twitter: Design, discourse, and implications of public text”. The Routledge Handbook of Language and Digital Communication, ed. by Alexandra Georgakopoulou & Tereza Spilioti, 239–256. London & New York: Routledge.
Taavitsainen, Irma & Päivi Pahta. 2003. “English in Finland: Globalisation, language awareness and questions of identity”. English Today 19(4): 3–15.
Tagliamonte, Sali & Derek Denis. 2008. “Linguistic ruin? Lol! Instant messaging and teen language”. American Speech 83(1): 3–34. http://www.jstor.org/stable/40281250
Tumasjan, Andranik, Timm O. Sprenger, Philipp G. Sandner & Isabell M. Welpe. 2010. “Predicting elections with Twitter: What 140 characters reveal about political sentiment”. Proceedings of the Fourth International AAAI Conference on Weblogs and Social Media, 178–185. Menlo Park, CA: AAAI Press.
Twitter. 2016. Company Facts. https://about.twitter.com/company
Vandergriff, Ilona. 2014. “A pragmatic investigation of emoticon use in nonnative/native speaker text chat”. Language@Internet 11(4). http://nbn-resolving.de/urn:nbn:de:0009-7-39846
Wikström, Peter. 2014. “#srynotfunny: Communicative functions of hashtags on Twitter”. SKY Journal of Linguistics 27: 127–152.
Wolf, Alecia. 2000. “Emotional expression online: Gender differences in emoticon use”. Cyber Psychology and Behavior 3: 827–833.
Yang, Jaewon & Jure Leskovec. 2011. “Patterns of temporal variation in online media”. Proceedings of the Fourth ACM International Conference on Web Search and Data Mining. (WSDM ’11), 177–186. New York: ACM. doi:10.1145/1935826.1935863
Zappavigna, Michele. 2011. “Ambient affiliation: A linguistic perspective on Twitter”. New Media and Society 13(5): 788–806.