Studies in Variation, Contacts and Change in English
Studies in Variation, Contacts and Change in English
Robert Daugs
Christian-Albrechts-University of Kiel
The purpose of this study is to shed new light on the diachrony of modal expressions in AmE and relativize earlier results concerning particular patterns of modal development that have long since been accepted among linguists. First, I will provide data from COHA on a relatively uncharted research field, i.e. modal/semi-modal variation and change in 19th century AmE. Secondly, while my data confirm a general decline in the frequency of the modal verbs in AmE over the 20th century, a closer look at their long-term individual developments suggests that particularly the subdivision of the modals into frequent and infrequent ones and the ‘bottom weighting’ of the frequency loss observed in Leech (2003, 2011, 2013) and Leech et al. (2009) need revision. And thirdly, the opposing frequency shifts of will and be going to will receive some attention, as their respective developments point to a possible overall change in referring to future time in English.
Modal variation and change has received a lot of attention over the past few decades, with the modals and semi-modals being among the most frequently cited cases regarding grammatical change in English. Studies on the restructuring of the modal system generally indicate a significant decline in the use of modals (e.g. shall, must), while at the same time, a group of semantically related expressions, commonly referred to as semi-modals (e.g. be going to, have to), undergoes a remarkable overall increase. Given that most of these studies (e.g. Leech 2003, Smith 2003, Mair & Leech 2006, Leech et al. 2009, Leech 2011, Leech 2013, Smith & Leech 2013, Mair 2015) are either entirely or partly based on data obtained from the Brown family of corpora (BROWN), the increasing availability of new corpora encourages further research in this field – certainly because some of the findings of these studies are hardly ever challenged. [1] [2]
This paper introduces new and more fine-grained data on modals and semi-modals in AmE over the span of the 19th and 20th century obtained from the Corpus of Historical American English (COHA) (Davies 2010–) and the Corpus of Contemporary American English (COCA) (Davies 2008–). [3] These data will be measured against the aforementioned findings, i.e. (i) the overall decrease in the use of modal verbs, (ii) the persistence of this trend, (iii) the underlying pattern observed, and (iv) the rise of the semi-modals. I will furthermore turn to a particular modal/semi-modal pair, namely the case of will versus be going to, as their respective frequency shifts indicate a significant change regarding future time reference in AmE.
This section provides a concise summary of some of the data concerning modal verbs and semi-modals in English that have become quite well-known over the past decades. I will carry out my analysis in reference to some prominent results and test whether they can be upheld under the premise of new evidence provided in section 5.
The first observation regarding modal verbs concerns their overall development, more specifically that the frequency of English modals has decreased significantly over the past 50–100 years (cf. e.g. Leech 2003, Biber 2004, Leech et al. 2009; Leech 2011, Seggewiß 2012, Leech 2013, Smith & Leech 2013). This trend is found in the two national standard varieties AmE and BrE and it appears to be more acute in spoken registers. The AmE data on modals from Leech et al.’s (2009) study, which will serve as a starting point for my analysis, are shown in Table 1.
| BROWN | COHA | |||||
|---|---|---|---|---|---|---|
| Brown (1961) | Frown (1991) | Change (%) | 1960s | 1990s | Change (%) | |
| would | 3,053 | 2,868 | *-5.2 | 3,485 | 3,219 | **-7.6 |
| will | 2,702 | 2,402 | ***-10.3 | 2,968 | 2,677 | ***-9.8 |
| can | 2,193 | 2,160 | -0.7 | 2,131 | 2,346 | **10.1 |
| could | 1,776 | 1,655 | -6.0 | 1,994 | 2,084 | 4.5 |
| may | 1,298 | 878 | ***-31.8 | 811 | 645 | ***-20.5 |
| should | 910 | 787 | **-12.8 | 770 | 697 | -9.5 |
| must | 1,018 | 668 | ***-33.8 | 807 | 522 | ***-35.3 |
| might | 665 | 635 | -3.7 | 667 | 581 | *-12.9 |
| shall | 267 | 150 | ***-43.3 | 155 | 72 | ***-53.5 |
| ought (to) | 69 | 49 | -28.4 | 90 | 49 | ***-45.6 |
| need(n’t) | 40 | 35 | -11.7 | 25 | 16 | -36.0 |
| Total | 13,991 | 12,287 | ***-11.4 | 13,903 | 12,908 | ***-7.2 |
Table 1. Frequencies of modals in AmE based on BROWN (Leech et al. 2009: 283) and COHA (Leech 2011: 553).
Note: The asterisk ‘*’ indicates different levels of statistical significance: * = p < 0.05, ** = p < 0.01, *** = p < 0.001. Also, the data from BROWN show the raw frequencies, while the frequencies in COHA are normalized per million words (pmw). In both cases, ‘Change(%)’ is based on the frequency (pmw). [4]
According to the BROWN figures in Table 1, there is a significant 11.4% decrease in the frequency of modals regarded as a whole between 1961 and 1991 in AmE. Furthermore, individual modals decline at different rates (e.g. can -0.7%, shall -43.3%). Table 1 also shows that this general trend was confirmed in Leech (2011) with data obtained from COHA. Between the 1960s and the 1990s the modals undergo a significant overall 7.2% loss in frequency.
Leech’s (2011) study also substantiates a second hypothesis, i.e. that the demise of the modals appears to be a long lasting trend, which Leech (2003) and Leech et al. (2009) could only speculate on, as BROWN, at the time, covered a thirty-year period that was represented through two data points only. With decadal data points spread over one hundred years and a significantly larger size in terms of overall word count, Leech’s COHA data indicate that “the decline of modals has been general in AmE since the 1910s” (2011: 552). By contrast, a more recent contribution to modal/semi-modal variation and change based on BROWN by Mair (2015) suggests that the long-term trend of modal decline cannot be confirmed. He extends Leech et al.’s (2009) findings with data from the 1930s analogue of BROWN (namely B-Brown), which was not available to Leech at the time. From B-Brown (1930s) to Brown (1961) the modals increase by 12% at a significance of p < 0.0001, which almost completely counterbalances the 12.2% decline from Brown (1961) to Frown (1991) resulting in an insignificant overall decline of 1.6% over the entire 60-year period (cf. Mair 2015: 131–132). Consequently, Mair rightfully questions which evidence to trust –
three small but carefully matched corpora [B-Brown, Brown and Frown], which show ups and downs in consecutive thirty-year intervals levelling out to stability, or a less rigidly structured mega-corpus [COHA], which records a statistically significant decline of the modals for the same period and the 20th century as a whole [by 20.9%]. (2015: 133)
The differences between the corpora are quite well-known. A survey of the composition of COHA, i.e. size and internal structure, is provided by Davies (2012a). For details on the architecture of BROWN see, for example, Leech et al. (2009: 24–50) and Hundt & Leech (2012: 176–180). Both the advantages and disadvantages of using larger or smaller corpora continue to be subject of an ongoing debate; with reference to COHA and BROWN, these are discussed in Davies (2012b) and Hundt & Leech (2012). While it is suggested that BROWN shows a higher degree of accuracy with regard to sampling and tagging (cf. Hundt & Leech 2012: 178–179), the advantages of COHA concerning the overall word count, covered time span and the availability of numerous data points cannot be so easily dismissed (cf. Davies 2012b: 161–163). In line with Hundt & Leech (2012), Mair also argues in favor of using small corpora (such as BROWN) “which are both stratified by genre internally and carefully matched for genre for comparison across corpora” (2015: 133). The importance of considering register-specific variations concerning the frequency distribution of modal expressions has been shown in various studies (e.g. Biber 2004, Leech et al. 2009, Leech 2011), but it should be acknowledged that both BROWN and COHA have a register-balanced structure and do not simply represent a big, undifferentiated pile of data. Yet, the choice in favor of COHA is sensible here on the premise of providing new evidence regarding the variation and change of modal expressions in AmE, especially with data from the 19th century.
Furthermore, Leech (2003, 2011, 2013) and Leech et al. (2009) point a specific pattern of modal decline, labelled as a “‘bottom weighting’ of the frequency loss” (Leech et al. 2009: 73). Accordingly, there is a tendency for the most frequent modals (will, would, can and could) regarded as a group to remain relatively stable in their frequency across the decades, whereas the lower frequency modals decline even further and become more marginalized. This pattern is shown in Figure 1.
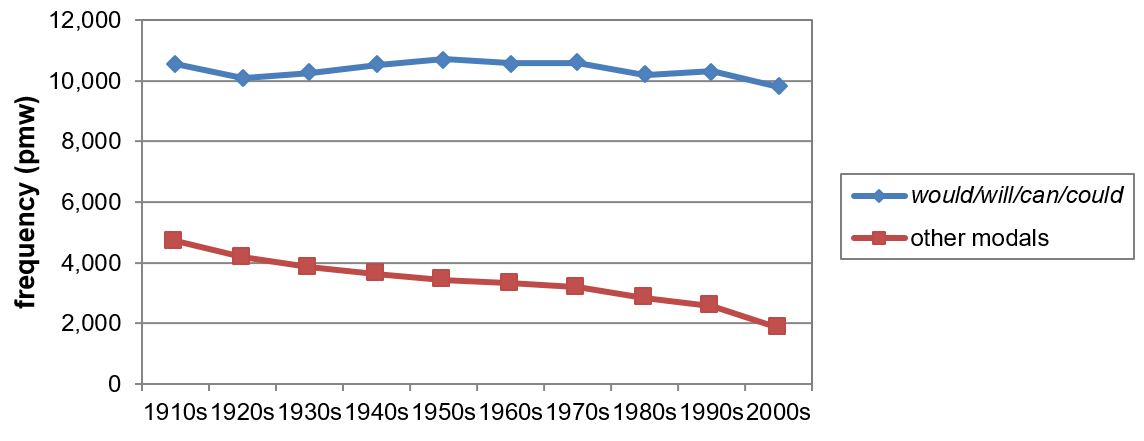
Figure 1. Declining frequency of the seven less frequent modals in COHA, contrasted with persisting frequency of the four most frequent modals (Leech 2011: 555, Leech 2013: 103).
From the curve progressions in Figure 1, Leech’s conclusion seems quite plausible. The downwards trend of the less frequent modals (red curve) is as much as 60.6%, while the overall decline of the four most common modals (blue curve) only amounts to 7.0% over the course of the 20th century. Consequently, it seems as if the low(er) frequency modals are responsible for the overall modal decline. This picture, however, is misleading for a number of reasons to be discussed in Section 5 of this study. With data from both BROWN and COHA, I will show that Leech’s conclusion regarding this observed pattern is based on a misconception and should thus be revised.
In seeking an explanation for the demise of the modal verbs, the focus is generally shifted towards the semi-modals. The final issue that is investigated here concerns their overall development, which, in contrast to the modal verbs, shows a significant increase in contemporary English (see e.g. Leech 2003, Millar 2009, Leech 2011); in some cases (e.g. have to, want to, be going to), their increased usage can (at least in some registers) even be traced back as early as late ME or EModE (see e.g. Krug 2000, Biber 2004). The AmE data from BROWN indicate that the semi-modals have increased in their use by 18.5% from Brown to Frown (cf. Leech et al. 2009: 286) and by 43.4% from B-Brown to Frown (cf. Mair 2015: 137). [5] Given their overall rise and their status as syntactic and semantic modal competitors, it is tempting to assume that the semi-modals are gradually usurping the functions of the modal verbs. However, a number of studies (e.g. Biber et al. 1999, Leech 2003, Mair & Leech 2006, Leech et al. 2009, Leech 2013) show that the semi-modals as a whole are still seriously outnumbered by the modal verbs in PDE, thus refuting the ‘displacement hypothesis’ in general. Only the respective frequency distributions of must and have to as a competing modal/semi-modal pair suggest otherwise.
Researchers do not agree on the classification of modal expressions and studies may vary considerably as to which expressions are included in their analyses. The category modality, as any other linguistic category, shows gradience. Members can be determined on the basis of morphosyntactic and/or semantic criteria, but also from a synchronic or diachronic perspective. But due to the ongoing change within the modal system, no classification is likely to be permanent.
For the present study, I will focus on two sets of modal expressions. The first set, henceforth simply referred to as modals, which includes will, would, can, could, shall, should, may, might and must, is arguably the most coherent. All members of this set conform to Huddleston’s (1980) NICE properties, Quirk’s et al. (1985: 120–128) criteria for modal auxiliaries and, according to Collins (2009: 19), exhibit the ability to convey both ‘epistemic’ and ‘root’ meaning. [6] The second set, commonly called semi-modals, is characterized by its rather loose definition. While there seems to be agreement on its more prototypical members, namely have to and be going to, the status of less typical examples, such as be able to or be allowed to, and a broad spectrum of possible contenders (e.g. be about to, be meant to) indicate class-internal heterogeneity. The suggested list of semi-modals analyzed here includes have to, be going to, want to, need to, (have) got to, be able to, be supposed to, be allowed to and be to. These periphrastic expressions are characterized by having distinct formal, functional, and semantic attributes: (i) they are constructed with a following infinitive marker (that may be weakened in colloquial speech, e.g. want to → wanna, be going to → gonna); (ii) they can operate as suppletives where the modals are morphosyntactically unavailable, cf. e.g. *musted vs. had to; (iii) they have undergone some degree of grammaticalization, e.g. phonetic reduction as in gotta, or semantic change from possessive have to semi-modal have to indicating obligation; and (iv) they are semantically competing (to some extent) with at least one of the modals, cf. e.g. You must be joking and You’ve got to be joking. [7]
Note that peripheral or marginal cases, such as dare (to), used to, ought (to) and need(n’t) + bare infinitive, have been omitted on the basis of their (very) infrequent usage and their less typical modal status, i.e. inter alia the possibility to construct them as both main verbs and auxiliaries. (Had) better, even though sometimes considered a semi-modal or emergent modal (see e.g. Leech et al. 2009 or Smith & Leech 2013), is not included either; compared to the other semi-modals, its functionality is much more limited.
As mentioned above, the advantages of both COHA and COCA stand out. With over 400 million words each, a covered time span from 1810 to 2009 with decadal data points in COHA and from 1990 to 2012 with five-year data points in COCA, a register-balanced structure, and open access, the BYU-corpora provide a (statistically) solid database for researching different variables in AmE. This supplementary bulk of (new) data, i.e. over 13 million entries in absolute numbers for modals and semi-modals over two centuries combined, certainly facilitates further analyses on the subject of modality in a number of different ways. In this section, I will briefly describe the procedure adopted for this study to obtain the data from COHA and COCA. For the sake of comparability, my overall selection of modals and semi-modals is for the most part congruent with Leech et al. (2009) and Leech (2011). It must be noted that Leech’s (2011) data on modal development over the 20th century in AmE are replicated here using the method explained below. Given that Leech does not describe his methodology in detail, the minor discrepancies in the frequency counts between his data (2011: 553) and the data presented in Table A2 in this study are then likely to be due to differences in the respective procedures employed. While the numbers do not differ too greatly, reproducing the data for the 20th century was nevertheless deemed a necessary step in order to maintain procedural consistency with regard to the new data on modal/semi-modal variation and change over the 19th century, which the present study contributes. The data from the 19th and 20th century can thus be compared more accurately.
To reduce the problem of precision the search queries were run by using POS-tags whenever possible. In the case of the modals, this process was rather straightforward, as the CLAWS 7 tagset (C7) used for tagging the BYU-corpora includes a separate tag for modals, i.e. ‘VM’. Generating the data for the semi-modals, on the other hand, presents a few more complications in terms of accuracy and ambiguity, due to their multi-word structure. Next to searching for the most basic, inflected forms of the respective semi-modals (e.g. wants to, being able to, had to), additional queries were run to reduce the problem of recall by accounting for different syntactic variations, i.e. negation (example 1a below), adverb insertion (1b), negation + adverb insertion (1c), and inversion (1d). [8]
| (1) | (a) | Since dating is not supposed to include emotional involvement, how can this be explained? [COHA NF1952] |
| (b) | He was always allowed to come to the table, because he was an only child; and of course he could not fail to hear his father's eulogies on the good effect of a glass of brandy and water after dinner. [COHA FIC1835] | |
| (c) | Yes, but it's not perfect. Intelligence is not necessarily going to prevent every attack. [COCA SPOK2006] | |
| (d) | By reason of the cessation of the bombardment at night, were you not able to rest and recruit your garrison? [COHA MAG1871] |
An overview of the search strings that were used for obtaining the frequencies of modals and semi-modals from COHA and COCA is provided in Table 2 below. Cliticized and phonetically reduced forms (e.g. can’t, she’s going to, wanna) are included in the analyses.
| Modal expression | Main search string | Additional strings |
|---|---|---|
| can, will, must etc. | [vm*] | |
| be able to | [vb*]_able_[to*] | [vb*]_*_able_[to*] [vb*]_[xx*]_*_able_[to*] [vb*]_*_[xx*]_able_[to*] |
| be allowed to | [vb*]_allowed_[to*] | [vb*]_*_allowed_[to*] [vb*]_[xx*]_*_allowed_[to*] [vb*]_*_[xx*]_allowed_[to*] |
| be going to, gonna | [vb*]_going_[to*] | [vb*]_*_going_[to*] [vb*]_[xx*]_*_going_[to*] [vb*]_*_[xx*]_going_[to*] goin_’_[to*] gon_na |
| be supposed to | [vb*]_supposed_[to*] | [vb*]_*_supposed_[to*] [vb*]_[xx*]_*_supposed_[to*] [vb*]_*_[xx*]_supposed_[to*] |
| have to | [vh*]_[to*] | havin_’_[to*] |
| (have) got to, gotta | got_[to*] | |
| want to, wanna | [want].[v*]_[to*] | wantin_’_[to*] wan_na |
| need to | [need].[v*]_[to*] | |
| be to | [y*]_[p*]_[vb*]_[to*] [y*]_[n*]_[vb*]_[to*] |
Table 2. Search string syntax for obtaining frequencies of modals and semi-modals in COHA and COCA.
Note: The web-interface’s query syntax requires a space between every slot within a search string in order to recognize distinct words and punctuation, which is indicated here by an underscore.
Due its formal ambiguity, the syntactic environment for BE to (in Table 2) had to be confined to a large extent, limiting its occurrence to the second position within any given clause that is preceded by a punctuation mark. As a result, its overall numbers are relatively low and the comparability with the other semi-modals appears to be diminished. However, the proposed search string setup has proven helpful to disambiguate the search results to large extent, as it automatically excludes numerous cases that display non-semi-modal usage of BE + to in succeeding positions, which may otherwise only be tested manually, see the example in (2).
| (2) | You guys even followed leads from psychics? That's how desperate you were to find this girl. [COCA SPOK2009] |
In (2), “were” and “to” do not form a conceptual unit. Here, the infinitive marker introduces a non-finite clause (to find this girl).
Subsequent to the search queries, the raw data (i.e. absolute tokens) were exported from the web-interface into a self-designed calculation matrix that generates both the standardized, register-specific frequencies (based on the respective sub-corpora compositions of COHA and COCA) and the log-likelihood values. The form of the log-likelihood (LL) used here conforms to the one used by Paul Rayson’s calculator at UCREL. [9] Accordingly, four different levels of significance can be distinguished, see Table 3.
| p-values | ||||
|---|---|---|---|---|
| p < 0.05 | p < 0.01 | p < 0.001 | p < 0.0001 | |
| level | 5% | 1% | 0.1% | 0.01% |
| percentile | 95th | 99th | 99.9th | 99.99th |
| critical value | 3.84 | 6.63 | 10.83 | 15.13 |
| in-text marking | * | ** | *** | **** |
Table 3. Levels of statistical significance, log-likelihood ratio test.
Note that LL values do not account for ‘practical significance’, i.e. representativeness, homogeneity within the corpora, and comparability of the corpora (cf. Rayson et al. 2004: 926). In this regard, the data up to the 1870s in COHA are less reliable compared to the other decades. The 1810s and 1820s have been omitted altogether from the present study.
In the next section, the results of the analyses on modal/semi-modal variation and change over the past two centuries will be discussed. Issues to be addressed are (i) the long-term developments, (ii) the consideration of overall as opposed to individual frequency distributions and shifts, and (iii) the competition between specific modals and semi-modals.
The results presented in the following are discussed in the light of the previous research findings mentioned in Section 2. Diverging evidence will be emphasized. Note that the graphic illustrations provided here correspond to the respective tables in the Appendix. All frequencies are normalized (pmw).
A comparative analysis of the data from BROWN and COHA is an instructive step, as it reveals some interesting aspects regarding the diachrony of modals in AmE. Figure 2 presents a summary of the overall normalized frequency shifts of modals per decade in COHA from 1830 to 2009 compared to their development observed by Mair (2015) over the three data points in BROWN. [10]
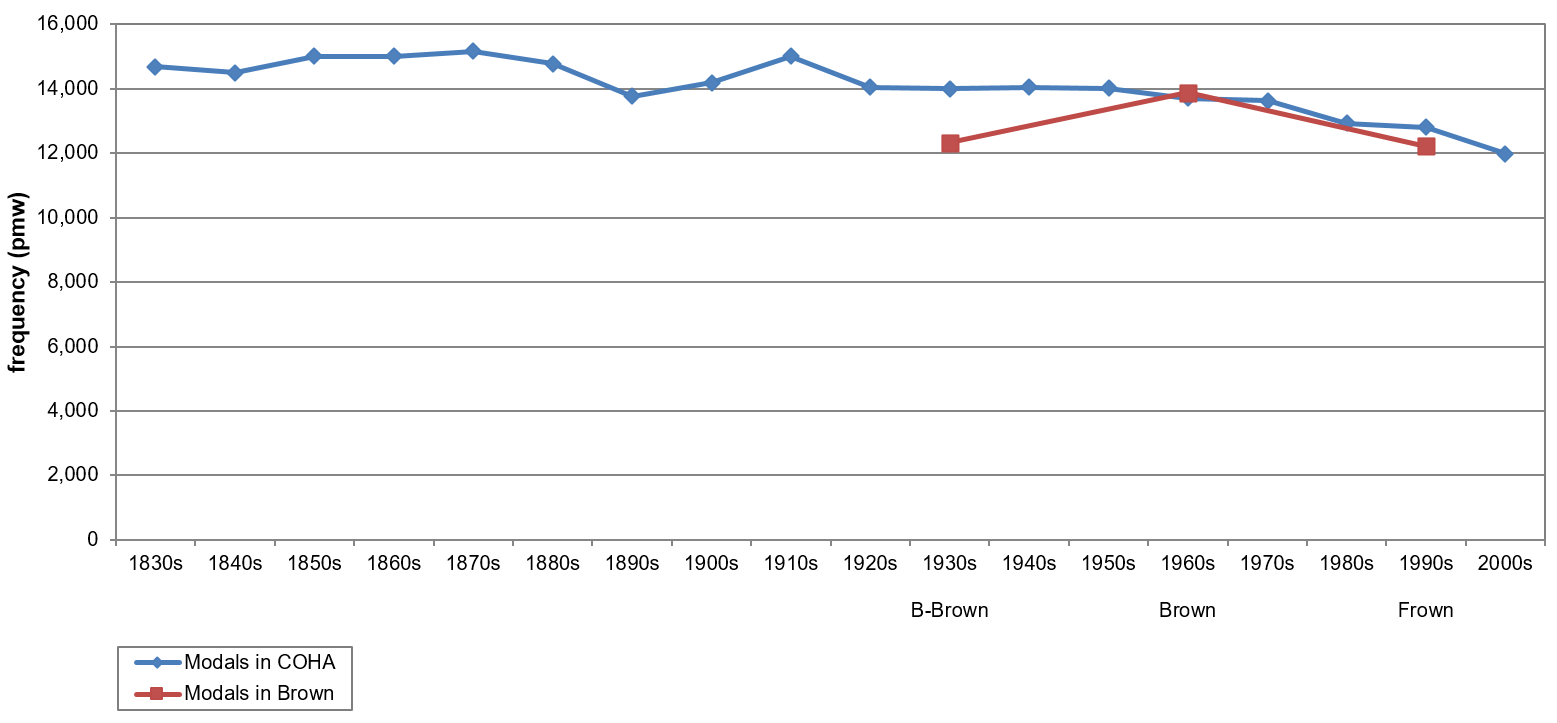
Figure 2. The overall frequency distribution of the modals in COHA (based on Tables A1, A2 and A3) and BROWN (based on Mair 2015: 131).
The trajectory representing the COHA data (blue curve) indicates a significant ****18.4% decrease in the use of modals as a whole since the 1830s. This development, however, is not gradual. While the downwards trend in modal usage is undeniable after the 1910s with even an accelerated decrease from the 1950s onwards (cf. Leech 2011: 553), the period between the 1830s and the 1910s is marked by some fluctuations. From the 1830s to the 1890s, the modals show a relatively small but significant ****6.3% decrease in their frequency largely due to a ****9.24% dip between 1870 and the 1890s, which is followed by a ****9.0% increase until the 1910s. Given such a long-term perspective, these temporary fluctuations are not too surprising, but any generalizations regarding the overall modal decline are thus somewhat impaired. A closer look at modal development in different registers shows that the overall frequency distributions are particularly uneven in non-fiction books (NON-FICTION) and newspaper articles (NEWS) prior to the 1930s, see Figure 3.
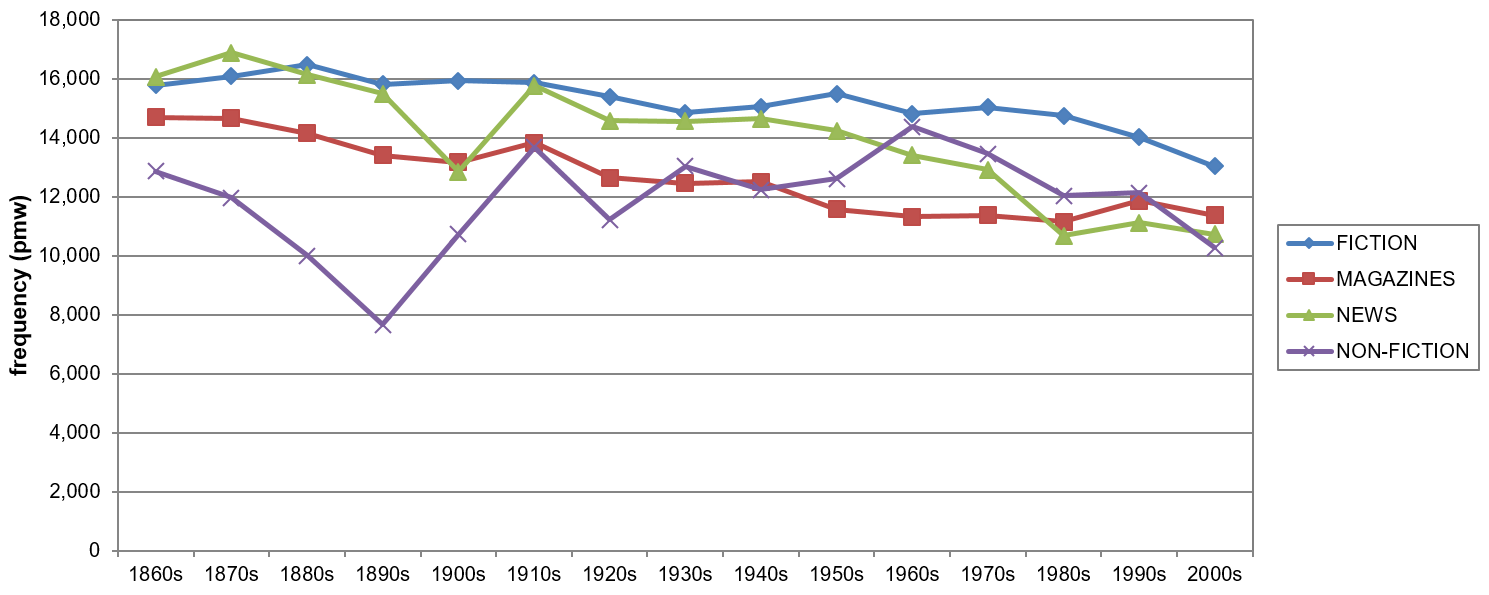
Figure 3. Overall modal development across different registers in COHA, 1860s-2000s (based on Table A4).
Despite the fact that all registers record a general decline in the use of modals when comparing the 1860s and 2000s, the frequency distribution of the modals in NON-FICTION (purple curve) is characterized by an extremely fluctuating progression, which may be largely due to the heterogeneity of that particular section, i.e. different text types and text selection. This can be substantiated with the data for individual modal development in that register, as nearly all of them follow the same trend between the 1860s and the 1910s thus accounting for the distinct V-shape progression over that period, see Figure 4.
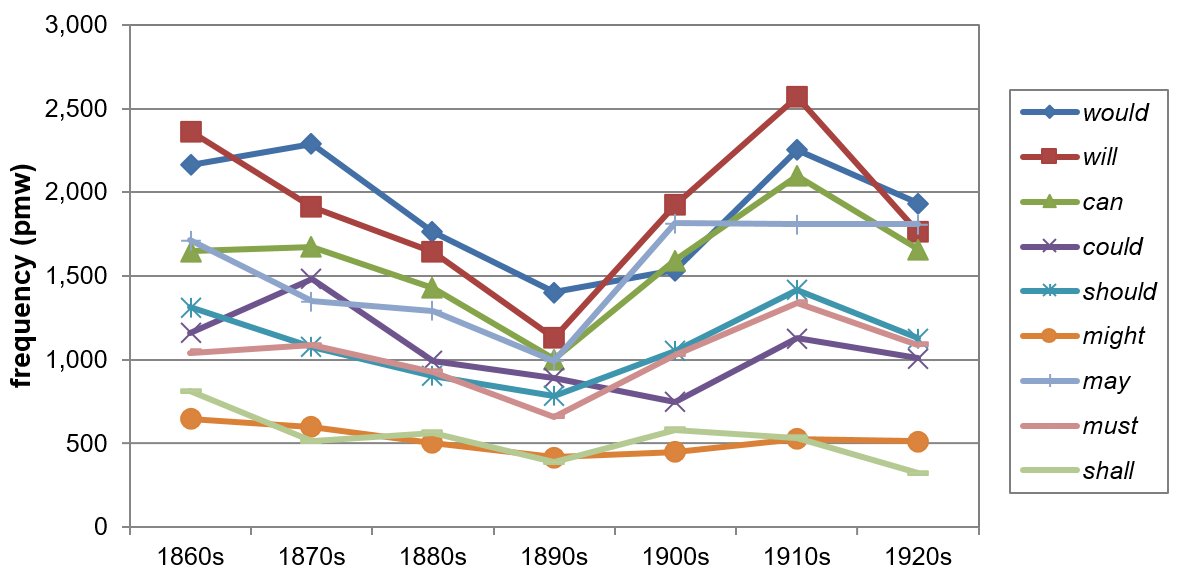
Figure 4. Individual modal developments in non-fiction books (NON-FICTION), COHA, 1860s-1920s (based on Table A5).
It seems rather unlikely that natural language change or change in stylistic conventions alone could explain such a conspicuous development, but without a more in-depth analysis of the respective text types as well as the text selection, this is somewhat speculative.
Apart from this supposed internal imbalance in COHA, a comparison between Mair’s (2015) observations in BROWN (red curve in Figure 2) and the COHA data (blue curve in Figure 2) also deserves further consideration. According to his data, modals are insignificantly less used in Frown than they are in B-Brown, i.e. the increase from B-Brown to Brown is a little more than evened-out in Frown, which clearly results in divergent trends (cf. 2015: 131–132 and Table A2 this study). Although COHA and BROWN show nearly identical frequency distributions in the 1960s and 1990s, modal usage is 13.6% higher in COHA than in BROWN in the 1930s. As can be seen, the decades around the 1930s are characterized by stability in COHA. Due to fact that the frequency distribution of modals in BROWN and COHA are nearly identical for the 1960s and 1990s, it is certainly difficult to determine which data is more reliable. While Mair (2015: 140) correctly notes that the chances of observing statistical outliers increase when a dataset consists of shorter intervals (e.g. COHA), it must be noted that the influence of a possible outlier on the overall results in a dataset with very few intervals (in this case, BROWN) is more significant. Whether the data from B-Brown are in line with a more persistent trend or merely a statistical outlier can only be confirmed with additional data points. To offer some further tentative remarks on this particular problem – Biber’s (2004) study on modals in ARCHER (A Representative Corpus of Historical English Registers) supports the claim that their decline is a long-lasting trend dating back to the 1900s (at least), which is consistent with the findings in COHA. Furthermore, Mair’s (2015) data indicate a small decline in modal usage from B-LOB (1931) to LOB (1961), which are the BrE equivalents of B-Brown and Brown – a pattern that is also accounted for in Leech (2013). The additional data from B-LOB (1901) provided in Leech point to a rather stable frequency distribution from 1901 to 1961 in BrE, similar to the one found in COHA over the same period (cf. 2013: 99, 102). Now,
[w]hile there is no necessity that a frequency trend in AmE should follow the same path as a frequency trend in BrE, previous research […] shows that such parallel changes are much more common than changes in which the two varieties diverge. (Leech 2011: 552)
Even though this may seem compelling, two things must be considered. First, expecting parallel developments over both national standard varieties, despite being common, is problematic, since differential change in BrE and AmE has been shown and discussed in, for example, Hundt & Dose (2012) and Mair (2014). Although their studies provide evidence of divergent trends in the use of the progressive passive and the development of the semi-modal (have) got to, respectively, it seems plausible to also consider a possible divergence in the use of modals in both varieties. And secondly, it should also be noted that the problem of large(r) chronological gaps found in BROWN is even more acute in the case of ARCHER, which offers data points per 50–100 years with less data overall, which may also represent statistical outliers. This issue is certainly reduced in COHA, as the distinctly larger amount of data is more likely to level statistical distortion. Additional releases of AmE components in BROWN or other historical resources of AmE data could help to resolve this issue.
It was mentioned in Section 2 that the bottom weighting of the frequency loss observed in Leech (2003, 2011, 2013) and Leech et al. (2009) is flawed. The conclusion drawn from this pattern hinges on the presupposition that modals may be grouped according to their frequency distribution into high-frequency and low-frequency modals, as illustrated in Figure 1. Figure 5, on the other hand, indicates that the development of individual modals challenges Leech’s approach.
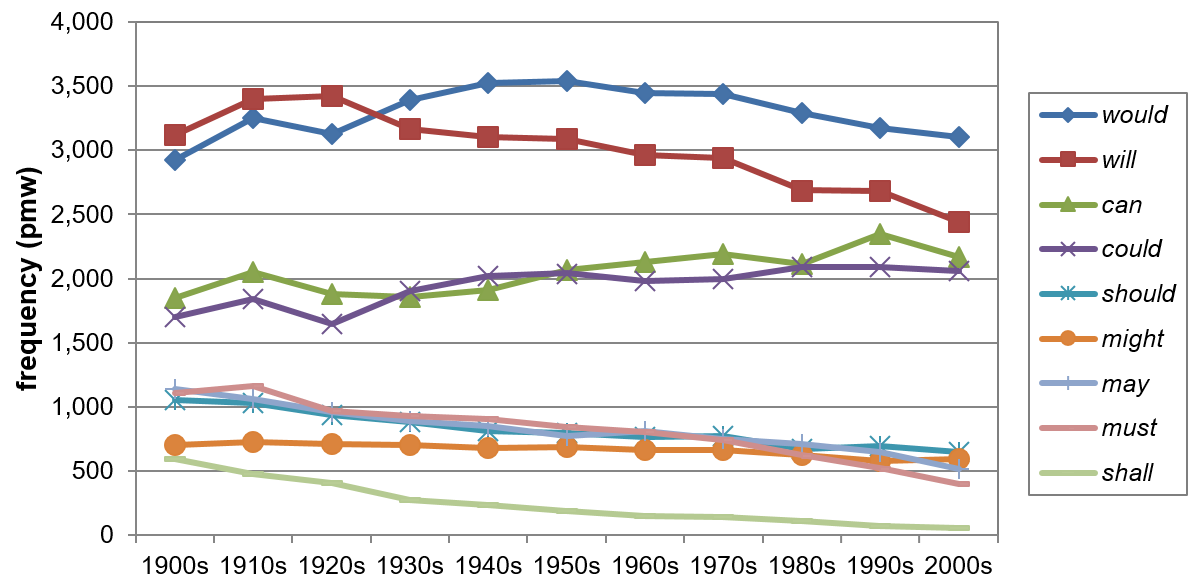
Figure 5. Frequency shifts of individual modals from 1900 to 2009 in COHA (based on Table A2).
The evidence presented here suggests that the high-frequency modals (will, would, can and could) are historically not a homogenous group and analyzing them as such conceals the facts that (i) up to the 1950s can and could cannot be clearly affiliated with either the frequent or the infrequent modals, and (ii) that the decline in the frequency of will over the 20th century is responsible for the second highest contribution (after must) to the overall modal decrease.
Starting from the 2000s, an argument can be made in favor of the approach that differentiates between the most common and least common modals. A backwards shift in time, however, clearly shows that the modals, if anything, split into three groups, given that the curve progressions for the modals at the top of the frequency list are obviously marked by divergent trends. Can and could, as opposed to will and would, show rather steady and significant increases in their use over the course of the century by ****17.2% and ****21.2% respectively. The increase in the use of would amounts to ****6.2% from the 1900s to the 2000s, yet the modal progresses in a way that results in a somewhat flattened bell curve, showing an increase from the 1900s to its peak in the 1950s, before eventually decreasing again.
The development of will is particularly interesting. According to the COHA data, its demise over the 20th century is as much as ****21.7%. The drastic downwards trend after the 1920s leads to a change in the frequency ranking, with will no longer being at the top of the list. More importantly, the development of will suggests that the claim of a bottom weighting of the frequency loss in the use of the modals cannot be maintained. This deserves further explanation. First, it should be noted that the lower frequency modals (should, might, may, must, shall) are decreasing without exception, but this change manifests at different rates (e.g. might → ****16.1%, shall → ****91.1%). In terms of relative change (i.e. percentage change from the 1900s to the 2000s), these modals record the highest frequency losses (see Table A2); but these figures overestimate their actual share in the overall decline. In terms of token losses (pmw), must (707) and the high-frequency modal will (676) lead the way, accounting for 23.1% and 22.1%, respectively, of the absolute decline; by contrast, low-frequency modals, such as might, should and shall merely contribute 3.7%, 13.1% and 17.7%, respectively.
It thus becomes apparent that the tendency of the four most common modals to collectively hold their own over the course of the 20th century, as proposed by e.g. Leech (2011: 556) or Leech (2013: 103), neglects this group’s underlying heterogeneity. Leech’s (2003) and Mair’s (2015) data on individual modal developments in BROWN show a quite similar picture, see Figure 6.
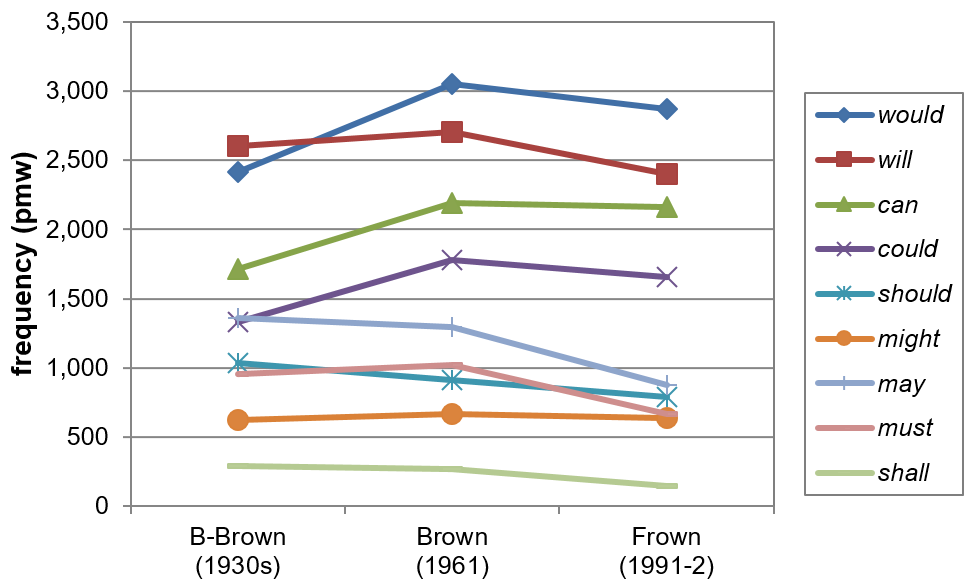
Figure 6. Frequency shifts of individual modals in BROWN (based on Mair 2015: 131).
Again, the four most common modals do not seem to develop alike. While can and could show significant increases in their use from B-Brown to Frown (****25.7% and ****24.3% respectively), the frequency of will is declining by **7.8% (cf. Mair 2015: 131). Parallel to their development in COHA (1900s–2000s), can and could take an intermediate position in Brown. In B-Brown, both modals appear to be more closely affiliated with the lower frequency cases, with could even undercutting may regarding their frequency distribution. This development is mirrored in COHA (1830s–2000s) in a similar fashion but with a considerable time gap, as the trajectories for could and may converge roughly 90 years earlier, see Figure 7.
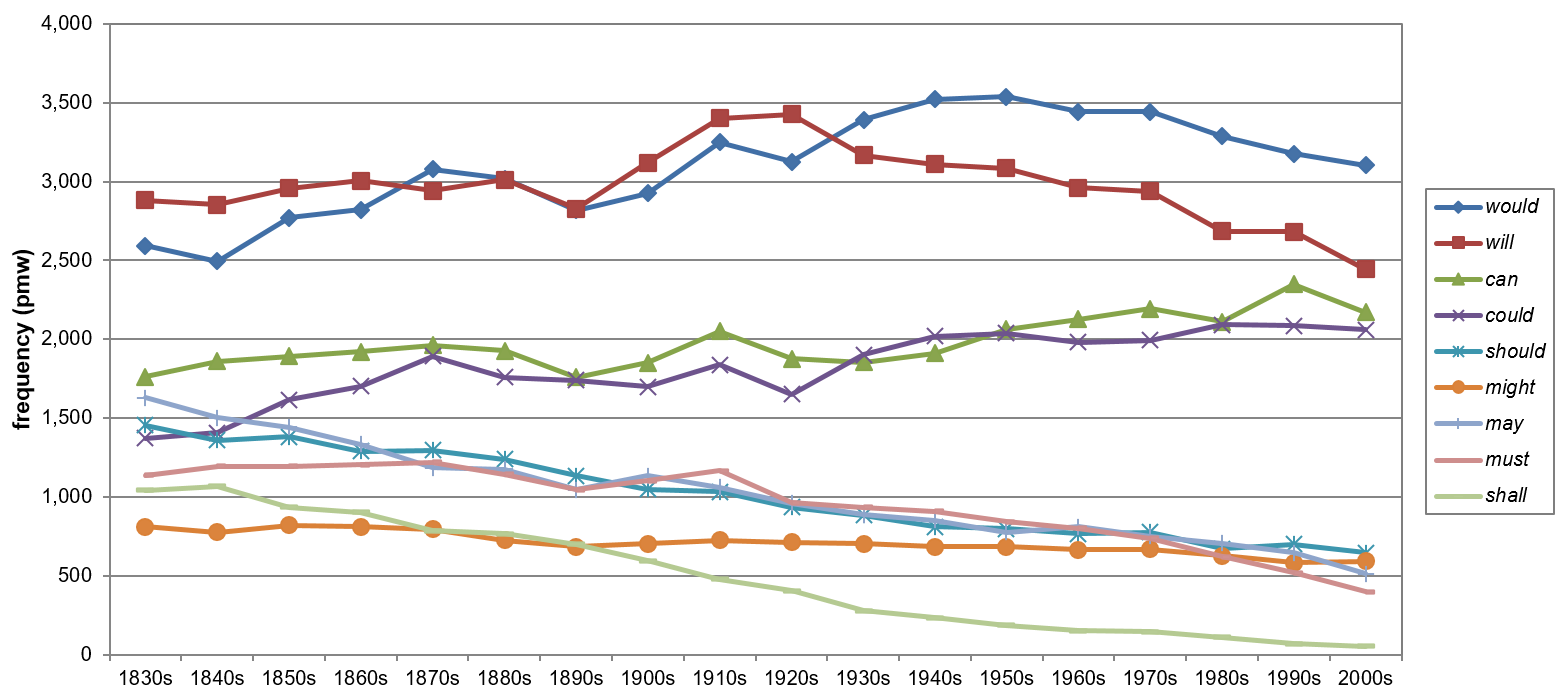
Figure 7. Frequency shifts of individual modals from 1830 to 2009 in COHA (based on Tables A1, A2 and A3).
As shown in Figures 5, 6 and 7, the tendency for less frequent modals to become more marginalized, as suggested in Leech (2003, 2011, 2013) can be confirmed for the most part. The data from BROWN and COHA indicate that shall, should and may (apart from its single ****8.6% increase between the 1890s and 1900s) have been decreasing significantly in their frequency all along, see Table A1, A2 and A3. The development of might appears to be a stable but more moderate decline from the 1830s to 2000s, as the ****27.1% decrease over this period only amounts to 5.1% (or 3.7% from 1900 to 2009) of the overall losses. Must behaves differently still. From the 1830s to the 1910s, the modal appears to be quite stable. Its rather famous, dramatic decline in usage only begins afterwards, with an accelerated frequency loss from the 1950s onwards, similar to its decreasing use from Brown to Frown.
In sum, the data from COHA and BROWN substantiate the claim that, from a historical perspective, the four most common modals do not behave consistently. Leech’s (2003, 2011, 2013) dichotomous approach, i.e. the classification of modals into frequent and infrequent ones, is only plausible when considering the frequency distribution of modals in the late 20th and early 21st century. Apart from that, both COHA and BROWN provide sufficient evidence against this approach.
Figure 8 shows the diachrony of semi-modals in AmE. As with the modals, the bulk of studies concerning the development of semi-modals are usually based on data from BROWN. To my knowledge, the latest contribution that provides extensive coverage on the development of semi-modals from B-Brown to Frown is Mair (2015). With the exception of be to, his data indicate a general increase in the use of semi-modals in written AmE between the 1930s and 1991; however, individual developments are quite heterogeneous in terms of relative frequency changes, with, for example, be able to exhibiting a rather moderate increase it its use over the 60-year period, while need to increases more than four-fold (cf. Mair 2015: 137). Using both COHA and COCA, the present study provides data on very recent developments in the use of semi-modals in both written and spoken AmE and also traces the frequency shifts back to the 1830s. As noted earlier, the selection of semi-modals discussed in Section 3 may vary considerably depending on the respective research. Here, the selection is mainly guided by the (potential) semantic and syntactic competition with respect to the modals.
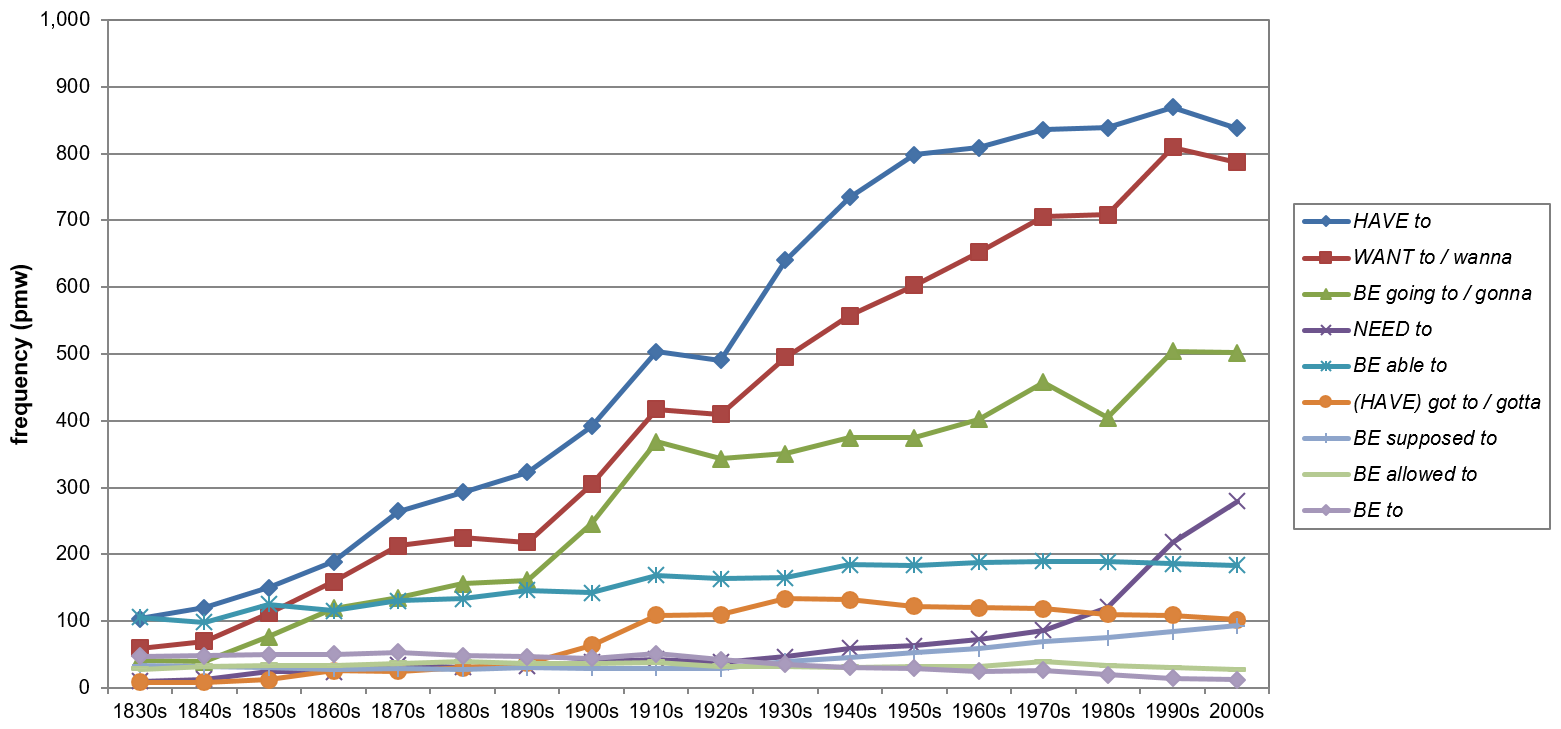
Figure 8. The frequency shifts of selected semi-modals from 1830 to 2009 in COHA (based on Tables A6, A7 and A8).
According to the COHA data, the semi-modals show a significant five-fold increase in their overall use between 1830 and 2009. Apparently, the general upwards trend in the frequency distribution splits into two main intervals (****1830s–1910s and ****1920s–1970s) delimited by two temporal setbacks (****1910s–1920s and *1970s–1980s).
The 1830s to the 1840s seem to be crucial for determining the beginning of the notable overall rise of the semi-modals, as this period is characterized by a rather moderate **5.6% increase in semi-modal usage, followed by several decades of significantly higher increases. The clinched picture of the individual frequency distributions in the 1830s further supports this claim. Only after the 1840s, three outliers, namely have to, want to and be going to, start to seriously establish themselves at the top of the frequency list, which also indicates that the overall increase in the use of semi-modals in general mostly hinges on these few members. Furthermore, it is obvious that have to, want to and be going to show parallel developments up to the 1920s. The respective patterns seem too similar to be accounted for by chance rather than synergy effects. Interestingly, from the 1930s onwards, be going to clearly slows down in its increase, while have to and want to keep rising in their previous fashion. In light of the significant decrease in the use of will discussed early in this paper, the development of be going to will receive further attention in Section 5.4.
A closer look at the overall increase in terms of tokens (pmw) indicates that the 20th century is more productive than the 19th century in helping the semi-modals rise to prominence. A noteworthy case along the lines of this process is need to. Although this semi-modal is still being used significantly less in the 2000s than have to, want to and be going to, its frequency has more than tripled between the 1970s and the 2000s, eventually overtaking (have) got to and be able to in the 1980s and 1990s respectively for the fourth place on the frequency list. An intriguing explanation for this remarkable increase, which is accompanied by a decrease in the use of must, is the so-called ‘democratization trend’, i.e. the avoidance of overt markers of authority in utterances conveying a directive (see e.g. Myhill 1995, Smith 2003, Leech et al. 2009). Furthermore, Mair notes that
[such] drastic increases in a very short period reflect the dynamic phase of ongoing grammaticalisation, in which semantic bleaching, the increasing conventionalisation of new grammatical patterns and their spread throughout all registers and text-types conspire to boost corpus frequencies. By comparison, [be] going to and [have] to represent mature instances of grammaticalisation […] still spreading forcefully in written English in the present. (2015: 136)
need to has apparently reached the phase of grammaticalization which have to, want to and be going to went through about 100 years earlier, given the similarity in the respective trajectories marked by a major initial increase.
Despite some (negligible) numerical discrepancies in the standardized frequencies, the observations regarding the general increase in the use of semi-modals in COHA between the 1930s and 1990s are for the most part in line with Mair’s (2015) findings in BROWN. By contrast, there is a clear divergence in the development of (have) got to across both databases. According to Mair (2015: 137), (have) got to records a 44.4% increase in its frequency from B-Brown to Frown, whereas the semi-modal shows a ****18.4% decrease over the same period in COHA. A similar decline (although restricted to specific text types, namely American plays and Drama&Movies) is also reported in Jankowski (2004: 95) and Lorenz (2013: 122–123). While this might be worth exploring further, the trend observable for (have) got to in BROWN should perhaps not be overestimated. As Mair notes, “the frequencies [of (have) got to] are moderate throughout [and] statistically significant patterning is absent in the data” (2015: 139).
Finally, as mentioned in Section 2, the semi-modals are still being used significantly less than the modals in PDE. With a ratio of 4.2:1 (modals to semi-modal) in the 2000s (COHA), this circumstance is not likely to change any time soon in written AmE. Seeing that both modals and semi-modals are more common in spoken than in written English (see e.g. Biber et al. 1999, Biber 2004), the obvious next step is to turn to COCA for additional data. It is expected that the COCA findings will confirm the evidence regarding a considerably less dramatic distributional modal/semi-modal gap in spoken English, as proposed by e.g Mair & Leech (2006) and Leech et al. (2009) on the basis of significantly smaller corpora, such as The Longman Corpus of Spoken American English (LCSAE). Figure 9 presents the respective overall frequency distributions of modals and semi-modals in the spoken register of COCA.
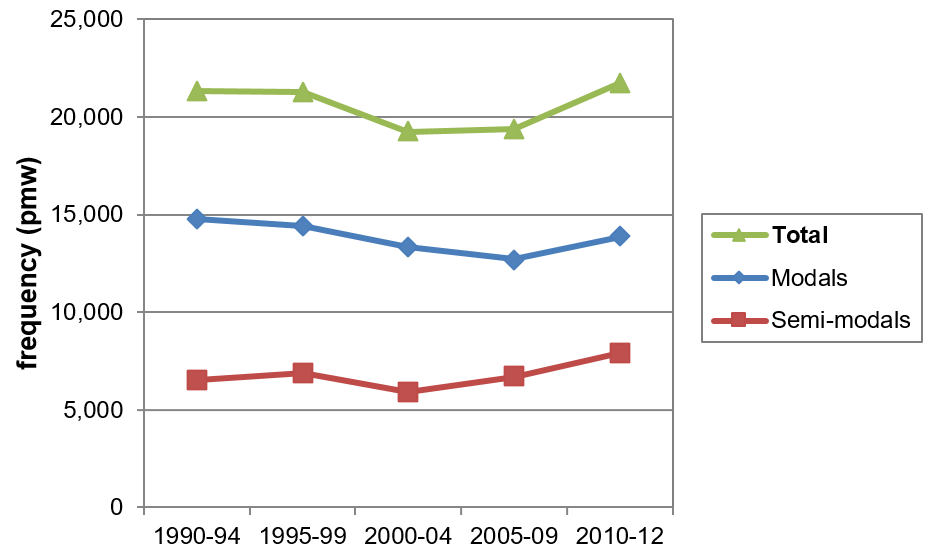
Figure 9. Frequency distribution of modals and semi-modals in COCA (spoken) (based on Tables A9 and A10).
Two conclusions can be drawn from the evidence provided in Figure 9 – (i) based on COCA’s spoken register, the modal/semi-modal ratio has improved considerably in favor of the semi-modals (1.7:1 modals to semi-modal in 2010–12); and (ii) the trajectory for the combined frequencies of modals and semi-modals (green curve) indicate that the respective trends eventually compensate for previous losses. In contrast, the data from the written components of COCA signal a moderate, but highly significant decline in the combined frequencies by ****3.2% from 1990 to 2012, see Tables A11 and A12. Yet, it seems too rash to speak of a general ‘modal deficit’ in this case, as proposed by Leech (2013: 106–107), without having considered data from COHA or COCA on any other means of expressing modality besides modals and semi-modals, such as modal adverbs (a), (mandative) subjunctives (b), or ‘modal periphrases’ (c), see the examples in (3). [11]
| (3) | (a) | One strain in her character that our divorce has touched is that she is possibly less resilient than she has been before in her life, and worry about getting older is proof of it. [COHA FIC1986] |
| (b) | Turney is suspended on an unrelated incident; influential African-American ministers demand that he be taken off the streets. [COHA NEWS2004] | |
| (c) | Participants almost always consider it more probable that the woman is both a bank teller and an activist in the feminist movement than that the woman is simply a bank teller. [COHA MAG1995] |
I will, however, discuss this deficit in regard to the modal/semi-modal pair will/be going to in the following section.
In contrast to have to, which has overtaken its modal counterpart must in both spoken and written AmE, be going to is still lagging behind will, especially in written AmE. While it is generally accepted that will is formally a modal verb, it may be debatable whether its main function as a future tense marker falls within the domain of modality, given the traditional distinction between the categories modality and tense. However, reference works on English grammar in general (e.g. Quirk et al. 1985, Bybee et al. 1994, Biber et al. 1999, Huddleston & Pullum 2002) as well as numerous studies on modality in particular (e.g. Lyons 1977, Coates 1983, Bybee et al. 1991, Krug 2000, Palmer 2001, Leech 2004, Collins 2009) have adopted the approach of treating the future time reference (of will and be going to) as another modal function, as they are “so closely intermingled that it is difficult to separate them” (Leech 2004: 56). Given that “futurity always involves an element of doubt or uncertainty, it inevitably overlaps with modality” (Coates 1983: 169). Consequently, the following analysis of will and be going to in both COHA and COCA is based on the view that their functional meanings (root > willingness, intention; epistemic > prediction, predictability) are all closely related to the concept of futurity (cf. Coates 1983: 169–204).
Due to its development over the past century, will certainly demands further attention, as the significant decline in the use of this particular modal raises questions regarding a possible overall change in referring to future time. [12] In this respect, arguably, the first candidate one would think of is be going to and whether the increase in its use, although being itself still seriously outnumbered by will in present-day AmE, is capable of compensating for the modal’s declining frequency. To illustrate the issue, the respective developments of will and be going to in COHA from 1910 to 2009 are shown in Figure 10.
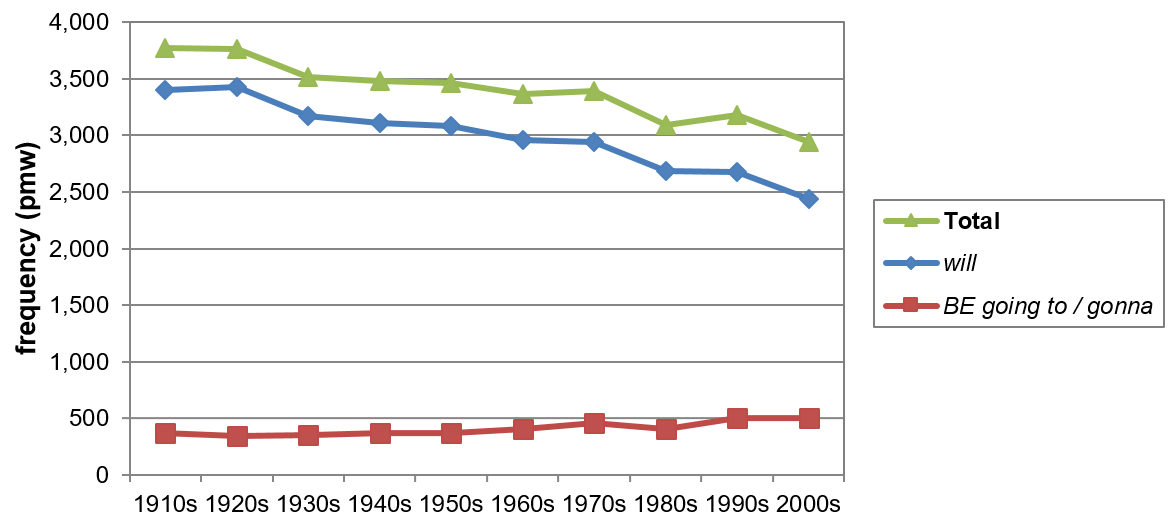
Figure 10. The converging frequency shifts of will and be going to from 1910 to 2009 in COHA (based on Tables A2 and A7).
The overall deficit caused by the combined frequencies of will and be going to from 1910 to 2009 is ****21.8%. Three questions instantly arise – (i) how conclusive is the ratio of the frequencies of the two future tense markers in describing an actual deficit; (ii) to what extent can this trend be observed in spoken AmE; and (iii) what is the role of other means of referring to future time in English? The evidence, although intriguing, undoubtedly merits in-depth research; however, within the scope of this study, I will only allude to some issues. For a comprehensive discussion on the semantic development of future time expressions in BrE (based on ARCHER) see Nesselhauf (2012).
The first question insinuates that the relative change in the combined frequencies of will and be going to may be a relatively unstable measure, as the development of will could just as well fall in line with a more general decline in the use of verbs in AmE as a whole, thus diminishing the significance of the ‘future marker deficit’. To confirm whether the observation in Figure 10 is robust, this deficit was measured against the frequency distribution of verbs in general over the same period. The COHA data revealed that verbs remained quite stable from the 1910s to the 2000s in written AmE (+*0.2%), therefore indicating that the decline in the use of will is indeed significant.
To shed light on whether the trend in Figure 10 is also observable for spoken AmE, the data from COCA must be reconsidered.
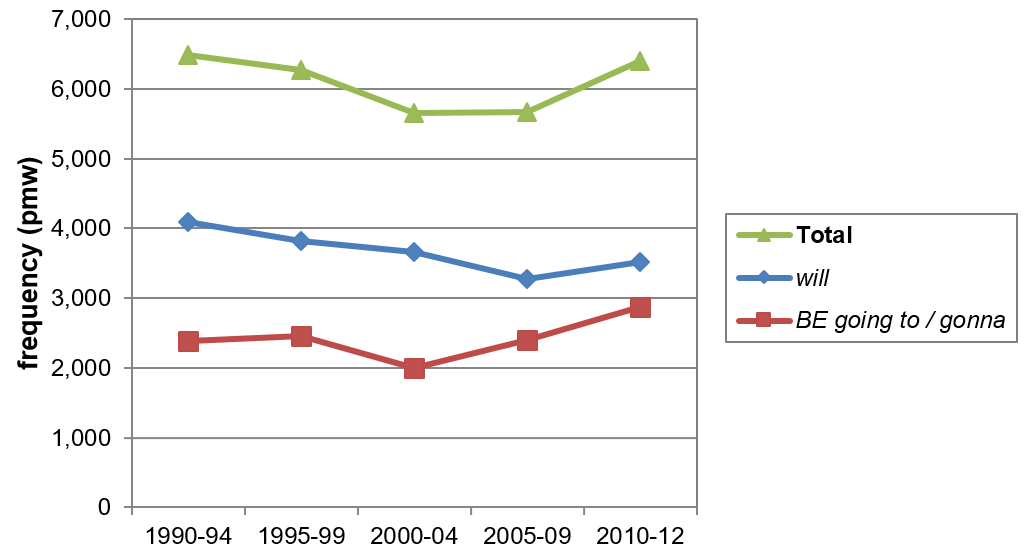
Figure 11. The frequency distributions of will and be going to in COCA (spoken) (based on Tables A9 and A10).
As shown in Figure 11, no deficit can be detected. By 2010–12, be going to has nearly caught up with will in spoken AmE. The significant ****43.7% increase in the use of be going to from 2000 to 2012 suggest that the underlying grammaticalization process continues to thrive, making the semi-modal a serious competitor of will in the spoken register; see Szmrecsanyi (2003) for a similar observation in the Santa Barbara Corpus of Spoken American English (CSAE). A tentative explanation why this trend has not spread in the same fashion in written texts is a possible time lag caused by two opposing factors, i.e. colloquialization and a ‘prestige barrier’ (cf. Leech 2013: 110–111). While colloquialization extends the use of semi-modals to written registers, it is slowed down by “the taboo that discourages the use of highly colloquial forms [such as gonna or wanna] in written (especially printed) texts” (Leech 2013: 110). Accordingly, the apparent deficit caused by will and be going to in written AmE may eventually become smaller.
While it is tempting to assume that will and be going to, as the main overt markers of future tense in English, are largely responsible for an overall change in the future tense system in written AmE, the evidence shown in Figure 10 cannot be fully explained without considering other expressions referring to future time, e.g. the progressive (which is generally increasing in its usage, see e.g. Hundt 2004, Leech et al. 2009) or non-predicative elements, such as adverbs or complex noun phrases. A possible starting point for further research may be a closer analysis of potential future time adverbs (e.g. tomorrow, soon), simply because they are single word items and fairly easy to trace within a corpus, see also Nesselhauf (2012). Other means, such as the futurate progressive or the futurate simple present, are far more complex. While traditional grammatical descriptions suggest that either requires a time adverbial to mark (remote) futurity (see e.g. Quirk et al. 1985, Palmer 1987, Leech 2004), more recent corpus-based accounts indicate that at least the progressive increasingly expresses futurity without any specifying time adverbials in PDE (see e.g. Nesselhauf & Römer 2007, Nesselhauf 2011). For the futurate present, however, Hilpert (2008: 160) argues that cases which exhibit co-occurrence of present tense forms and future time adverbials encode future time reference unambiguously. Consequently, a quantitative analysis of future time adverbials would include some cases of the futurate simple present (and arguably cases of the futurate progressive) and might therefore be a good starting point altogether. Yet, this debate certainly leads away from modals and semi-modals, which are the focus of this study.
My investigation has provided new and refined data on the diachrony of modals and semi-modals obtained from two sizable corpora of AmE, i.e. COHA and COCA. It has been shown that modals in general have been significantly decreasing in written texts since the 1830s. While this trend seems irrefutable from the 1950s onwards, the evidence is certainly less conclusive for the 19th and early 20th century, given the significant fluctuations in the overall frequency shift over the course of this period. Furthermore, the diachronic analysis of individual modal developments has revealed that the high-frequency modals (would, will, can, could) are not behaving homogenously at all and that their declared stability as a group proves to be misleading. As opposed to can and could, which record significant increases in their use, the demise of will is eventually responsible for more than one-fifth of the overall losses of the modals, placing it right behind must as the ‘biggest losers’ over the course the 20th century.
Contrary to the overall development of modals in AmE, a selected group of semi-modals shows tremendous increases in its frequency, indicating an ongoing exemplary process of grammaticalization. Again, the importance of considering individual developments has been demonstrated, as the semi-modals clearly emerge at different rates. In this regard, the 1840s/1850s apparently mark the beginning of their rise, especially the most advanced members of this category, namely have to, want to and be going to. A noteworthy case of a more recent emergence is undoubtedly need to, which has overtaken (have) got to and be able to for the fourth place on the frequency list by the late 20th century. However, despite these developments, it must be noted that the semi-modals are still seriously outnumbered by the modals in all registers. Although this picture is not nearly as dramatic in spoken AmE, where the semi-modals seem to (at least partially) catch up with their modal counterparts, actual modal displacement can thus far only be reported for an isolated case, i.e. have to and must.
The competition between modals and semi-modals (or the lack thereof) is nevertheless intriguing. In particular, this study has alluded to the peculiar case of will versus be going to. The incapability of be going to to even remotely compensate for the declining use of will in written AmE raises questions regarding a possible change in referring to future time. Of course, considering other means of marking future tense in AmE, such as the progressive or adverbs of time, this is not the whole story.
Without doubt, modals and semi-modals have already received considerable and thorough attention – but it would be misleading to claim that there is hardly any research left to be done. The amount of additional quantitative data presented here alone certainly facilitates further analyses in this field, quantitative as well as qualitative.
[1] Counterevidence for the overall modal decline was first attested in Millar (2009). Even though his study focuses purely on data from the TIME Magazine Corpus (TIME) (Davies 2007–), which may be representative of that particular news magazine only and should thus be treated with caution (see Leech 2011 for a detailed and critical discussion), it certainly illustrates the importance of considering additional resources, as the data appear to be quite sensitive towards situationally-defined variations. [Go back up]
[2] BROWN (all capitals) refers to the AmE component of the Brown family of corpora, i.e. B-Brown, Brown and Frown. [Go back up]
[3] Note that all the data from COCA have been obtained prior to its most recent update in December 2015. [Go back up]
[4] The log-likelihood values (LL values) in the COHA column are not given by Leech but were added using his (2011) figures and procedure which, curiously, seem to rely on normalized frequencies to calculate the significance levels. I am grateful to Paul Rayson for confirming that LL values take different corpus sizes into account and should thus be calculated on the basis of raw rather than normalized frequencies (p.c., February 2016). While this would not really be dramatic in the case of the BROWN data (given that each corpus in BROWN contains roughly one million words), using frequencies (pmw) for the LL values of the COHA data underestimates the actual significance in most cases. This certainly explains the differences in the significance levels presented here as compared to Leech (2011: 553). I also thank Christian Mair for explaining the inconsistency between his (2015) and Leech et al.’s (2009) data regarding the percentage changes in the frequency distribution observed for modals from Brown to Frown. He identified two possible error sources – (i) differences in the databases used, i.e. BROWN (untagged) as opposed to BROWN (tagged), and (ii) differences in rounding the normalized frequencies (Mair p.c., March 2016). [Go back up]
[5] The overall percentage change in the use of the semi-modals from B-Brown to Frown is not provided by Mair but was calculated on the basis of his figures for individual semi-modals (cf. 2015: 137). [Go back up]
[6] The present study will not provide a critical discussion on functional divisions of modal meaning. This has been done exhaustively in Depraetere & Reed (2006). Instead, I will simply adopt Coates’ view here from her (1983) corpus-based framework. [Go back up]
[7] I am aware that the issue described in (iv) oversimplifies the problem of interchangeability, as the semantic relatedness between modals and semi-modals is a highly controversial subject that typically requires a close analysis of semantic as well as socio-pragmatic factors. [Go back up]
[8] Examples obtained from COHA/COCA are cited with the respective corpus, register abbreviation and year of publishing – fiction (FIC), newspapers (NEWS), magazines (MAG), non-fiction books (NF), spoken (SPOK). To re-do the queries, click on the respective links provided with each example. The links will open in a new tab. [Go back up]
[9] See http://ucrel.lancs.ac.uk/llwizard.html. [Go back up]
[10] Note that the selection of modals in BROWN, as proposed in Leech (2003) and Mair (2015), has been adjusted according to the one presented in Section 3 of this study, which means that ought (to) and need(n’t) + bare infinitive are omitted. Since these marginal modals occur rather infrequently in AmE, the overall development is not significantly affected by this approach. [Go back up]
[11] The term ‘modal periphrases’ is adopted from Kranich & Gast (2015) and describes ad hoc formations that use lexical markers of modality. [Go back up]
[12] Note that in Section 5.4 will and be going to are compared purely on the basis of their overall frequency distributions. This approach may rightfully be criticized for not explicitly accounting for the different senses associated with each expression besides future time reference. However, a comprehensive corpus study by Collins (2009) suggests that the relative distribution of the different senses, i.e. epistemic and root, withineach expression is nearly identical. Admittedly, his results are based on synchronic data from considerably smaller corpora, which, of course poses problems regarding the comparability with the diachronic data presented here. Nevertheless, this step is believed to be sufficient in lending the data some substance and providing a possible indication that the future tense system is being restructured. [Go back up]
Biber, Douglas. 2004. “Modal use across registers and time”. Studies in the History of the English Language 2, ed. by Anne Curzan & Kimberly Emmons, 189–216. Berlin: Mouton de Gruyter.
Biber, Douglas, Stig Johansson, Geoffrey Leech, Susan Conrad & Edward Finegan. 1999. Longman Grammar of Spoken and Written English. London: Longman.
Bybee, Joan L., William Pagliuca & Revere Perkins. 1991. “Back to the future”. Approaches to Grammaticalization, vol. 2, ed. by Elizabeth Traugott & Bernd Heine, 17–58. Amsterdam: John Benjamins.
Bybee, Joan L., Revere Perkins & William Pagliuca. 1994. The Evolution of Grammar: Tense, Aspect, and Modality in the Languages of the World. Chicago: University of Chicago Press.
Coates, Jennifer. 1983. The Semantics of the Modal Auxiliaries. London: Croom Helm.
Collins, Peter. 2009. Modals and Quasi-modals in English. Amsterdam: Rodopi.
Davies, Mark. 2007–. TIME Magazine Corpus: 100 million words, 1920s–2000s. http://corpus.byu.edu/time/
Davies, Mark. 2008–. The Corpus of Contemporary American English: 450 million words, 1990–present. http://corpus.byu.edu/coca/
Davies, Mark. 2010–. The Corpus of Historical American English: 400 million words, 1810–2009. http://corpus.byu.edu/coha/
Davies, Mark. 2012a. “Expanding horizons in historical linguistics with the 400-million word Corpus of Historical American English”. Corpora 7(2): 121–157. doi:10.3366/cor.2012.0024
Davies, Mark. 2012b. “Some methodological issues related to corpus-based investigations of recent syntactic changes in English”. The Oxford Handbook of the History of English, ed. by Terttu Nevalainen & Elizabeth Closs Traugott, 157–174. Oxford: Oxford University Press.
Depraetere, Ilse & Susan Reed. 2006. “Mood and Modality in English”. The Handbook of English Linguistics, ed. by Bas Aarts & April McMahon, 269–290. Oxford: Blackwell.
Francis, W. Nelson & Henry Kučera. 1964. The Standard Corpus of Present-Day Edited American English (the Brown Corpus). The Cooperative Research Program of the U.S. Office of Education & Brown University. http://www.helsinki.fi/varieng/CoRD/corpora/BROWN/
Hilpert, Martin. 2008. Germanic Future Construction: A Usage-based Approach to Language Change. Amsterdam: John Benjamins.
Huddleston, Rodney. 1980. “Criteria for auxiliaries and modals”. Studies in English Linguistics for Randolph Quirk, ed. by Sidney Greenbaum, Jan Svartvik, Randolph Quirk & Geoffrey Leech, 65–78. London: Longman.
Huddleston, Rodney & Geoffrey K. Pullum. 2002. The Cambridge Grammar of the English Language. Cambridge: Cambridge University Press.
Hundt, Marianne. 2004. “Animacy, agentivity, and the spread of the progressive in modern English”. English Language and Linguistics 8(1): 47–69.
Hundt, Marianne. 2004–2014. The 1930s BROWN Corpus (B-Brown). http://www.helsinki.fi/varieng/CoRD/corpora/B-BROWN/
Hundt, Marianne & Stefanie Dose. 2012. “Differential change in British and American English”. English Corpus Linguistics: Looking Back, Moving Forward. Papers from the 30th International Conference on English Language Research on Computerized Corpora (ICAME 30). Lancaster, UK, 27–31 May 2009, ed. by Sebastian Hoffmann, Paul Rayson & Geoffrey Leech, 79–101. Amsterdam: Rodopi.
Hundt, Marianne & Geoffrey Leech. 2012. “‘Small is beautiful’: On the value of standard reference corpora for observing recent grammatical change”. The Oxford Handbook of the History of English, ed. by Terttu Nevalainen & Elizabeth Closs Traugott, 175–188. Oxford: Oxford University Press.
Jankowski, Bridget. 2004. “A transatlantic perspective of variation and change in English deontic modality”. Toronto Working Papers in Linguistics 23(2): 85–113.
Kranich, Svenja & Volker Gast. 2015. “Explicitness of epistemic modal marking. Recent changes in British and American English”. Thinking Modally: English and Contrastive Studies on Modality, ed. by Juan Rafael Zamorano-Mansilla, Carmen Maíz, Elena Domínguez & Ma Victoria Martín de la Rosa, 3–22. Newcastle: Cambridge Scholars Publishing.
Krug, Manfred. 2000. Emerging English Modals. A Corpus-based Study of Grammaticalization. Berlin: Mouton de Gruyter.
Leech, Geoffrey. 2003. “Modality on the move: The English modal auxiliaries 1961–1992”. Modality in Contemporary English, ed. by Roberta Facchinetti, Manfred Krug & Frank Palmer, 233–240. Berlin: Mouton de Gruyter.
Leech, Geoffrey. 2004 [1971]. Meaning and the English Verb, 3rd edn. London: Longman.
Leech, Geoffrey. 2011. “The modals ARE declining: Reply to Neil Millar’s ‘Modal verbs in TIME: Frequency changes 1923–2006, International Journal of Corpus Linguistics 14:2, 191–220’”. International Journal of Corpus Linguistics 16(4): 547–564. doi:10.1075/ijcl.16.4.05lee
Leech, Geoffrey. 2013. “Where have all the modals gone? An essay on the declining frequency of core modal auxiliaries in recent standard English”. English Modality. Core, Periphery and Evidentiality, ed. by Juana I. Marín-Arerese, Marta Carretero, Jorge Arús Hita & Johan van der Auwera, 95–115. Berlin: Mouton de Gruyter.
Leech, Geoffrey, Marianne Hundt, Christian Mair & Nicholas Smith. 2009. Change in Contemporary English. Cambridge: Cambridge University Press.
Lorenz, David. 2013. Contractions of English Semi-modals: The Emancipating Effect of Frequency (New Ideas in Human Interaction/NIHIN). Freiburg: Universitätsbibliothek Albert-Ludwigs-Universität Freiburg dissertation. doi:10.6094/978-3-928969-28-4
Lyons, John. 1997. Semantics. Cambridge: Cambridge University Press.
Mair, Christian. 1992. The Freiburg-Brown Corpus of American English (Frown). DFG (German Research Foundation). http://www.helsinki.fi/varieng/CoRD/corpora/FROWN/
Mair, Christian. 2014. “Do we got a difference? – Divergent developments of semi-auxiliary (have) got (to) in BrE and AmE”. Late Modern English Syntax, ed. by Marianne Hundt, 56–76. Cambridge: Cambridge University Press.
Mair, Christian. 2015. “Cross-variety diachronic drifts and ephemeral regional contrasts: An analysis of modality in the extended Brown family of corpora and what it can tell us about the New Englishes”. Grammatical Change in English World-wide, ed. by Peter Collins, 119–146. Amsterdam: John Benjamins.
Mair, Christian & Geoffrey Leech. 2006. “Current changes in English syntax”. The Handbook of English Linguistics, ed. by Bas Aarts & April McMahon, 318–342. Oxford: Blackwell.
Millar, Neil. 2009. “Modal verbs in TIME: Frequency changes 1923–2006”. International Journal of Corpus Linguistics 14(2): 191–220. doi:10.1075/ijcl.14.2.03mil
Myhill, John. 1995. “Change and continuity in the functions of the American English modals”. Linguistics 33: 157–211.
Nesselhauf, Nadja. 2011. Temporal specifiers and markers of futurity: Rethinking factors of variation. ICAME Journal 35: 117–134.
Nessehauf, Nadja. 2012. “Mechanisms of language change in a functional system: The recent semantic evolution of English future time expressions”. Journal of Historical Linguistics 2(1). 83–132.
Nesselhauf, Nadja & Ute Römer. 2007. “Lexical-grammatical patterns in spoken English. The case of the progressive with future time reference”. International Journal of Corpus Linguistics 12(3): 297–333.
Palmer, Frank R. 1987 [1965]. The English Verb, 2nd edn. New York: Routledge.
Palmer, Frank R. 2001 [1986]. Mood and Modality, 2nd edn. Cambridge: Cambridge University Press.
Quirk, Randolph, Sydney Greenbaum, Geoffrey Leech & Jan Svartvik. 1985. A Comprehensive Grammar of the English Language. London & New York: Longman.
Rayson, Paul, Damon Berridge & Brian Francis. 2004. “Extending the Cochran rule for the comparison of word frequencies between corpora”. Le poids des mots: Proceedings of the 7th International Conference on Statistical Analysis of Textual Data (JADT 2004), vol. 2, ed. by Gérald Purnelle, Cédrick Fairon & Anne Dister, 926–936. Louvain La Neuve: Presses universitaires de Louvain.
Seggewiß, Frederike. 2012. Current Changes in English Modals: A Corpus-based Analysis of Present-day Spoken English. Freiburg: Albert-Ludwigs-Universität Freiburg dissertation.
Smith, Nicholas. 2003. “Changes in the modals and semi-modals of strong obligation and epistemic necessity in recent British English”. Modality in Contemporary English, ed. by Roberta Facchinetti, Manfred Krug & Frank Palmer, 241–266. Berlin: Mouton de Gruyter.
Smith, Nicholas & Geoffrey Leech. 2013. “Verb structures in twentieth-century British English”. Investigating Recent Language Change with Corpora, ed. by Bas Aarts, Joanne Close, Geoffrey Leech & Sean Wallis, 68–98. Cambridge: Cambridge University Press.
Szmrecsanyi, Benedikt. 2003. “Be going to versus will/shall: Does syntax matter?”. Journal of English Linguistics 31(4): 295–323.
Note: All frequencies listed in the Appendix are normalized (pmw) and rounded to the next whole number. Percentage changes are based on frequencies (pmw). The level of significance for a given change is marked according to Table 3, Section 4. Changes that are non-significant are left blank. For the sake of clarity, exact LL-values are provided for long-term changes only. In any case, the LL-values are based on raw frequencies and the respective (sub-)corpus sizes.
| 1830s | 1840s | 1850s | 1860s | 1870s | 1880s | 1890s | LL-value | Change (%) (1830s–1890s) |
|
|---|---|---|---|---|---|---|---|---|---|
| would | 2,594 | ****2,493 | ****2,773 | **2,823 | ****3,080 | ***3,019 | ****2,820 | 156.53 | 8.70 |
| will | 2,882 | 2,854 | ****2,959 | **3,009 | ***2,941 | ****3,011 | ****2,828 | 8.51 | -1.87 |
| can | 1,762 | ****1,858 | *1,890 | *1,922 | **1,963 | *1,930 | ****1,757 | 0.14 | -0.30 |
| could | 1,374 | *1,407 | ****1,616 | ****1,702 | ****1,894 | ****1,759 | 1,741 | 716.51 | 26.69 |
| should | 1,456 | ****1,357 | 1,382 | ****1,291 | 1,296 | ****1,240 | ****1,137 | 664.32 | -21.94 |
| might | 813 | ***775 | ****823 | 812 | 794 | ****724 | ****686 | 180.51 | -15.60 |
| may | 1,632 | ****1,502 | ****1,440 | ****1,331 | ****1,188 | 1,176 | ****1,046 | 2193.19 | -35.91 |
| must | 1,138 | ****1,193 | 1,194 | 1,203 | 1,220 | ****1,146 | ****1,047 | 63.43 | -7.99 |
| shall | 1,042 | *1,067 | ****933 | **904 | ****788 | *767 | ****700 | 1142.22 | -32.79 |
| Total | 14,695 | 14,507 | 15,009 | 14,997 | 15,164 | 14,771 | 13,763 | 510.91 | -6.34 |
| Change (%) per decade | ****-1.28 | ****3.46 | -0.08 | ****1.11 | ****-2.59 | ****-6.83 | |||
Table A1. Frequency distribution of modals in COHA from the 1830s to the 1890s.
| 1900s | 1910s | 1920s | 1930s | 1940s | 1950s | 1960s | 1970s | 1980s | 1990s | 2000s | LL-value | Change (%) (1900s–2000s) |
|
|---|---|---|---|---|---|---|---|---|---|---|---|---|---|
| would | ****2,923 | ****3,250 | ****3,126 | ****3,393 | ****3,524 | 3,539 | ****3,443 | 3,441 | ****3,286 | ****3,176 | ****3,103 | 137.10 | 6.16 |
| will | ****3,120 | ****3,401 | 3,425 | ****3,169 | ***3,107 | 3,086 | ****2,960 | 2,939 | ****2,686 | 2,681 | ****2,443 | 2118.41 | -21.68 |
| can | ****1,851 | ****2,048 | ****1,878 | 1,856 | ****1,910 | ****2,064 | ****2,127 | ****2,192 | ****2,113 | ****2,350 | ****2,170 | 644.71 | 17.23 |
| could | ***1,699 | ****1,838 | ****1,649 | ****1,904 | ****2,017 | 2,040 | ****1,983 | 1,995 | ****2,093 | 2,087 | ****2,060 | 883.61 | 21.25 |
| should | ****1,051 | 1,034 | ****935 | ****882 | ****813 | 798 | ***767 | 775 | ****672 | ***698 | ****649 | 2468.70 | -38.19 |
| might | *707 | *725 | 712 | 703 | **683 | 684 | **664 | 668 | ****628 | ****582 | 593 | 256.62 | -16.12 |
| may | ****1,136 | ****1,061 | ****959 | ****889 | ****852 | ****776 | ****811 | ****753 | ****708 | ****647 | ****516 | 6195.21 | -54.55 |
| must | ****1,106 | ****1,167 | ****967 | ****933 | **909 | ****845 | ****804 | ****739 | ****622 | ****520 | ****399 | 9027.12 | -63.94 |
| shall | ****597 | ****477 | ****405 | ****278 | ****236 | ****188 | ****153 | *145 | ****111 | ****72 | ****53 | 14210.58 | -91.05 |
| Total | 14,189 | 15,002 | 14,055 | 14,005 | 14,050 | 14,021 | 13,711 | 13,647 | 12,918 | 12,813 | 11,987 | 4756.54 | -15.52 |
| Change (%) per decade | ****3.10 | ****5.73 | ****-6.31 | -0.36 | 0.32 | -0.20 | ****-2.21 | -0.46 | ****-5.34 | ***-0.81 | ****-6.44 |
Table A2. Frequency distribution of modals in COHA from the 1900s to the 2000s.
| 1830s | 2000s | LL-value | Change (%) (1830s–2000s) |
|
|---|---|---|---|---|
| would | 2,594 | 3,103 | 844.11 | 19.60 |
| will | 2,882 | 2,443 | 686.95 | -15.23 |
| can | 1,762 | 2,170 | 786.20 | 23.15 |
| could | 1,374 | 2,060 | 2525.31 | 49.87 |
| should | 1,456 | 649 | 6254.85 | -55.39 |
| might | 813 | 593 | 663.50 | -27.09 |
| may | 1,632 | 516 | 12262.28 | -68.36 |
| must | 1,138 | 399 | 7420.24 | -64.96 |
| shall | 1,042 | 53 | 23780.47 | -94.87 |
| Total | 14,695 | 11,987 | 5232.21 | -18.43 |
Table A3. The overall development of modals in COHA.
| 1860s | 1870s | 1880s | 1890s | 1900s | 1910s | 1920s | 1930s | 1940s | 1950s | 1960s | 1970s | 1980s | 1990s | 2000s | LL-value | Change (%) (1860s–2000s) |
|
|---|---|---|---|---|---|---|---|---|---|---|---|---|---|---|---|---|---|
| FICTION | 15,780 | ****16,088 | ****16,472 | ****15,822 | *15,931 | 15,860 | ****15,400 | ****14,853 | ****15,061 | ****15,498 | ****14,818 | ****15,035 | ****14,747 | ****14,020 | ****13,030 | 3034.61 | -17.42 |
| MAGAZINES | 14,697 | 14,663 | ****14,162 | ****13,415 | **13,175 | ****13,826 | ****12,639 | **12,466 | 12,516 | ****11,586 | ****11,320 | 11,373 | ***11,157 | ****11,865 | ****11,372 | 2419.24 | -22.62 |
| NEWS | 16,068 | **16,883 | ****16,147 | ****15,490 | ****12,855 | ****15,764 | ****14,584 | 14,570 | 14,648 | ****14,247 | ****13,405 | ****12,918 | ****10,673 | ****11,116 | ****10,734 | 560.63 | -33.20 |
| NON-FICTION | 12,865 | ****11,973 | ****10,005 | ****7,659 | ****10,728 | ****13,677 | ****11,227 | ****13,038 | ****12,246 | ****12,607 | ****14,378 | ****13,456 | ****12,028 | 12,143 | ****10,265 | 892.57 | -20.21 |
Table A4. The overall development of modals across different registers in COHA, 1860s–2000s.
| 1860s | 1870s | 1880s | 1890s | 1900s | 1910s | 1920s | LL-value | Change (%) (1860s–1920s) |
|
|---|---|---|---|---|---|---|---|---|---|
| would | 2,162 | **2,290 | ****1,762 | ****1,402 | ****1,535 | ****2,255 | ****1,934 | 42.07 | -10.56 |
| will | 2,366 | ****1,911 | ****1,644 | ****1,131 | ****1,925 | ****2,568 | ****1,761 | 294.84 | -25.56 |
| can | 1,648 | 1,675 | ****1,431 | ****1,002 | ****1,593 | ****2,098 | ****1,659 | 0.12 | 0.67 |
| could | 1,160 | ****1,480 | ****992 | ****889 | ****747 | ****1,129 | ****1,009 | 35.09 | -13.07 |
| should | 1,315 | ****1,073 | ****901 | ****783 | ****1,053 | ****1,419 | ****1,128 | 47.44 | -14.23 |
| might | 646 | *599 | ****501 | ****417 | *451 | ****529 | 513 | 50.39 | -20.54 |
| may | 1,713 | ****1,348 | *1,288 | ****991 | ****1,816 | 1,810 | 1,811 | 8.89 | 5.69 |
| must | 1,043 | 1,085 | ****924 | ****657 | ****1,027 | ****1,340 | ****1,090 | 3.47 | 4.54 |
| shall | 811 | ****512 | **561 | ****387 | ****581 | **531 | ****322 | 730.52 | -60.27 |
| Total | 12,865 | 11,973 | 10,005 | 7,659 | 10,728 | 13,677 | 11,227 | 368.20 | -12.73 |
| Change (%) per decade | ****-6.93 | ****-16.44 | ****-23.45 | ****40.07 | ****27.49 | ****-17.91 | |||
Table A5. Individual modal developments in non-fiction books (NON-FICTION), COHA, 1860s–1920s.
| 1830s | 1840s | 1850s | 1860s | 1870s | 1880s | 1890s | LL-value | Change (%) (1810s–1890s) |
|
|---|---|---|---|---|---|---|---|---|---|
| have to | 104 | ****120 | ****150 | ****189 | ****265 | ****293 | ****323 | 1904.17 | 211.63 |
| want to / wanna | 60 | ***70 | ****112 | ****159 | ****213 | *225 | 218 | 1537.72 | 265.30 |
| be going to / gonna | 42 | 40 | ****76 | ****120 | ****135 | ****156 | 161 | 1199.74 | 285.18 |
| need to | 10 | **13 | ****25 | 25 | ****35 | *31 | 33 | 206.93 | 230.85 |
| be able to | 106 | *98 | ****126 | **115 | ****130 | 134 | ***146 | 106.43 | 37.98 |
| (have) got to / gotta | 9 | 9 | ***12 | ****26 | 25 | ***31 | ***37 | 293.11 | 313.40 |
| be supposed to | 34 | 32 | 30 | 28 | 28 | 28 | 30 | 3.16 | -10.28 |
| be allowed to | 28 | *33 | 34 | 34 | 37 | 39 | 37 | 19.89 | 31.39 |
| be to | 47 | 49 | 50 | 51 | 54 | *48 | 47 | 0.07 | -1.37 |
| Total | 439 | 464 | 617 | 745 | 923 | 985 | 1,032 | 3987.73 | 134.95 |
| Change (%) per decade | **5.60 | ****32.96 | ****20.85 | ****23.83 | ****6.69 | ****4.81 | |||
Table A6. Frequency distribution of semi-modals in COHA from the 1830s to the 1890s.
| 1900s | 1910s | 1920s | 1930s | 1940s | 1950s | 1960s | 1970s | 1980s | 1990s | 2000s | LL-value | Change (%) (1900s–2000s) |
|
|---|---|---|---|---|---|---|---|---|---|---|---|---|---|
| have to | ****392 | ****503 | *490 | ****640 | ****735 | ****798 | 808 | ***836 | 838 | ***869 | ****838 | 4151.48 | 113.63 |
| want to / wanna | ****305 | ****418 | 410 | ****495 | ****557 | ****603 | ****652 | ****705 | 708 | ****810 | **787 | 5508.61 | 157.83 |
| be going to / gonna | ****246 | ****368 | ****343 | 350 | ****374 | 374 | ****403 | ****457 | ****404 | ****504 | 502 | 2249.93 | 104.08 |
| need to | ***39 | *43 | **39 | ****47 | ****59 | 63 | ****73 | ****86 | ****121 | ****218 | ****279 | 609.64 | 609.64 |
| be able to | 142 | ****169 | 163 | 165 | ****185 | 184 | 188 | 190 | 189 | 186 | 184 | 132.00 | 28.85 |
| (have) got to / gotta | ****64 | ****109 | 109 | ****133 | 132 | **123 | 120 | 119 | **110 | 109 | *102 | 226.60 | 60.09 |
| be supposed to | 29 | 29 | 28 | ****40 | **45 | ***52 | **59 | ****70 | *75 | ***84 | ***94 | 875.27 | 217.49 |
| be allowed to | 36 | 38 | **33 | 32 | 31 | 32 | 32 | ****39 | ***33 | *30 | 27 | 31.70 | -24.38 |
| be to | 44 | **51 | ****42 | ***35 | **31 | 30 | **25 | 27 | ****20 | ****15 | **12 | 508.05 | -72.40 |
| Total | 1,299 | 1,729 | 1,658 | 1,939 | 2,150 | 2,259 | 2,360 | 2,529 | 2,499 | 2,825 | 2,825 | 14526.89 | 117.44 |
| Change (%) per decade | ****25.89 | ****33.09 | ****-4.09 | ****16.92 | ****10.88 | ****5.07 | ****4.49 | ****7.16 | *-1.18 | ****13.03 | -0.01 |
Table A7. Frequency distribution of semi-modals in COHA from the 1900s to the 2000s.
| 1830s | 2000s | LL-value | Change (%) (1900s–2000s) |
|
|---|---|---|---|---|
| have to | 104 | 838 | 11127.41 | 708.49 |
| want to / wanna | 60 | 787 | 12502.70 | 1218.45 |
| be going to / gonna | 42 | 502 | 7746.18 | 1098.22 |
| need to | 10 | 279 | 5232.98 | 2728.18 |
| be able to | 106 | 184 | 383.30 | 73.29 |
| (have) got to / gotta | 9 | 102 | 1558.10 | 1046.83 |
| be supposed to | 34 | 94 | 516.96 | 176.43 |
| be allowed to | 28 | 27 | 0.16 | -2.46 |
| be to | 47 | 12 | 449.43 | -74.13 |
| Total | 439 | 2,825 | 33441.27 | 543.12 |
Table A8. The overall development of semi-modals in COHA.
| 1990–94 | 1995–99 | 2000–04 | 2005–09 | 2010–12 | LL-value | Change (%) (1990–2012) |
|
|---|---|---|---|---|---|---|---|
| will | 4,100 | ****3,816 | ****3,658 | ****3,271 | ****3,526 | 607.41 | -13.99 |
| can | 3,066 | ****3,203 | ****2,875 | ****3,017 | ****3,436 | 301.63 | 12.08 |
| would | 3,638 | ****3,545 | ****3,030 | ****2,884 | ****3,215 | 368.04 | -11.63 |
| could | 1,398 | ****1,444 | 1,446 | 1,442 | ****1,541 | 99.55 | 10.24 |
| should | 1,012 | 1,006 | ****864 | ***833 | ****937 | 40.80 | -7.42 |
| may | 758 | ****656 | ****696 | ****609 | **582 | 321.78 | -23.15 |
| might | 469 | 474 | ****505 | ****463 | 454 | 3.48 | -3.21 |
| must | 311 | ****240 | **226 | ****166 | 159 | 690.42 | -49.04 |
| shall | 24 | 25 | 23 | **19 | **24 | 0.09 | -2.23 |
| Total | 14,775 | 14,410 | 13,321 | 12,705 | 13,873 | 401.33 | -6.10 |
| Change (%) per decade | ****-2.47 | ****-7.55 | ****-4.63 | ****9.20 | |||
Table A9. Recent frequency shifts of modals in spoken AmE (COCA), 1990 to 2012.
| 1990–94 | 1995–99 | 2000–04 | 2005–09 | 2010–12 | LL-value | Change (%) (1990–2012) |
|
|---|---|---|---|---|---|---|---|
| be going to / gonna | 2,384 | ****2,458 | ****1,997 | ****2,396 | ****2,870 | 645.89 | 20.39 |
| want to / wanna | 1,443 | ****1,635 | ****1,382 | ****1,570 | ****1,844 | 707.93 | 27.83 |
| have to | 1,572 | 1,561 | ****1,379 | ****1,421 | ****1,631 | 15.33 | 3.74 |
| need to | 320 | ****382 | *397 | ****459 | ****571 | 1050.07 | 78.25 |
| (have) got to / gotta | 324 | 330 | ****254 | ****339 | ****409 | 141.40 | 26.16 |
| be able to | 343 | 343 | ****375 | *361 | ****401 | 63.07 | 16.66 |
| be supposed to | 99 | *106 | ****93 | 95 | ****113 | 14.40 | 14.80 |
| be allowed to | 48 | **42 | 40 | *35 | *41 | 7.04 | -13.97 |
| be to | 13 | 11 | 11 | 9 | 10 | 5.20 | -22.37 |
| Total | 6,546 | 6,869 | 5,926 | 6,686 | 7,890 | 1797.89 | 20.53 |
| Change (%) per decade | ****4.93 | ****-13.73 | ****12.83 | ****18.01 | |||
Table A10. Recent frequency shifts of semi-modals in spoken AmE (COCA), 1990 to 2012.
| 1990–94 | 1995–99 | 2000–04 | 2005–09 | 2010–12 | LL-value | Change (%) (1990–2012) |
|
|---|---|---|---|---|---|---|---|
| would | 2,607 | ****2,533 | ****2,480 | *2,498 | 2,513 | 92.91 | -3.58 |
| can | 2,257 | ****2,386 | *2,404 | ****2,367 | **2,341 | 83.51 | 3.70 |
| will | 2,558 | ****2,499 | ****2,447 | ****2,340 | ****2,297 | 761.99 | -10.19 |
| could | 1,566 | ****1,509 | *1,524 | ****1,554 | ****1,614 | 39.77 | 3.07 |
| should | 738 | 742 | ****710 | **697 | 704 | 44.00 | -4.62 |
| may | 867 | ****835 | ****810 | ****781 | ****720 | 742.85 | -16.99 |
| might | 513 | 508 | ****528 | ****546 | **533 | 19.97 | 3.80 |
| must | 551 | ****476 | ****444 | ****396 | ****371 | 1895.48 | -32.67 |
| shall | 52 | ****46 | ****37 | ****33 | ****26 | 477.93 | -50.37 |
| Total | 11,708 | 11,535 | 11,384 | 11,212 | 11,118 | 834.06 | -5.04 |
| Change (%) per decade | ****-1.48 | ****-1.31 | ****-1.51 | ****-0.84 | |||
Table A11. Recent frequency shifts of modals in COCA (written registers), 1990 to 2012.
| 1990–94 | 1995–99 | 2000–04 | 2005–09 | 2010–12 | LL-value | Change (%) (1990–2012) |
|
|---|---|---|---|---|---|---|---|
| have to | 710 | **722 | ****704 | *694 | **681 | 33.25 | -4.10 |
| want to / wanna | 581 | ****641 | 643 | 639 | *627 | 98.44 | 8.01 |
| be going to / gonna | 355 | ****382 | 377 | ****392 | ****373 | 25.12 | 5.14 |
| need to | 214 | ****252 | ****284 | ****327 | ****343 | 1690.25 | 60.19 |
| be able to | 198 | 197 | **204 | 206 | 209 | 18.82 | 5.97 |
| be supposed to | 58 | **61 | ****66 | *63 | *60 | 2.47 | 3.99 |
| (have) got to / gotta | 76 | 79 | *75 | ****69 | ****59 | 111.56 | -21.98 |
| be allowed to | 34 | **31 | **28 | *26 | 27 | 38.90 | -19.64 |
| be to | 16 | **15 | ***13 | **11 | *10 | 91.12 | -40.45 |
| Total | 2,240 | 2,378 | 2,394 | 2,428 | 2,389 | 262.06 | 6.63 |
| Change (%) per decade | ****6.16 | *0.65 | ****1.45 | ****-1.64 | |||
Table A12. Recent frequency shifts of semi-modals in COCA (written registers), 1990 to 2012.