Studies in Variation, Contacts and Change in English
Studies in Variation, Contacts and Change in English
Gerold Schneider, University of Konstanz and English Department, University of Zurich
Mennatallah El-Assady, University of Konstanz
Hans Martin Lehmann, English Department, University of Zurich
We present several approaches and methods which we develop or use to create workflows from data to evidence. They start with looking for specific items in large corpora, exploring overuse of particular items, and using off-the-shelf visualization such as GoogleViz. Second, we present the advanced visualization tools and pipelines which the Visualization Group at University of Konstanz is developing. After an overview, we apply statistical visualizations, Lexical Episode Plots and Interactive Hierarchical Modeling to the vast historical linguistics data offered by the Corpus of Historical American English (COHA), which ranges from 1800 to 2000. We investigate on the one hand the increase of noun compounds and visually illustrate correlations in the data over time. On the other hand we compute and visualize trends and topics in society from 1800 to 2000. We apply an incremental topic modeling algorithm to the extracted compound nouns to detect thematic changes throughout the investigated time period of 200 years. In this paper, we utilize various tailored analysis and visualization approaches to gain insight into the data from different perspectives.
We showcase a number of approaches and visualization methods which we and our teams use or develop at the University of Konstanz and at the University of Zurich. We illustrate our approach on the Corpus of Historical American English (COHA). COHA was collected by Mark Davies and ranges from 1810 to 2009. With over 400 million words, it is one of the largest corpora of diachronic English. The corpus is divided into the coarse genres of Fiction, Magazine, Newspaper, and Non-fiction Books (see Lijffit et al., this volume, for another approach to “core” genres of English). The CoRD entry for COHA gives more details. We have syntactically parsed the entire corpus with a dependency parser (Schneider 2008, Lehmann & Schneider 2012a).
The COHA corpus offers many new possibilities to researchers, as it covers a long period and due to its size suffers less from sparse data problems, particularly if lexical information is involved. We will mainly focus on two phenomena: first, the development and spread of noun compounds, and second, changes in topics and society in the covered period.
Leech et al. (2009) report a strong increase of noun + common noun sequences between 1960 and 1990 (+27%). In Late Modern English, these sequences were still quite rare, mostly restricted to appositions (e.g. the word university), genitives without ’s (e.g. Gods providence). In addition, on closer inspection it turns out that many sequences observed in the data are in fact due to tagging errors (e.g. anno decimo). Table 1 gives frequency data from the ARCHER corpus. Despite the fact that we have not filtered the above false positives, the differences are enormous, showing more than a threefold increase from the 17th to the 20th century.
| Century | F(noun-noun) | Per 1 million words |
|---|---|---|
| 1600 | 1598 | 3810 |
| 1700 | 3825 | 3850 |
| 1800 | 7890 | 6089 |
| 1900 | 17660 | 13033 |
Table 1. Frequency of noun-noun sequences in the ARCHER corpus.
One possible cause for the increase of noun compounds is the need for packaging and compressing information, as described by Biber (2003). We show in the following that compression is indeed a major reason.
Longer forms typically involving a prepositional phrase are shortened, lexicalized into a noun compound, for example change of climate is shortened to climate change, or room at/in a hotel to hotel room. Noun compounds seem to play a special role in the creation of neologisms and new important concepts (Lehmann & Schneider forthcoming). We will see in Section 2.3 that the gradual increase in noun compounds stems from many lexicalization steps of individual noun combinations. Only detailed visualizations can bring such an underlying mechanism to the surface.
The creation of new noun compounds is often linked to important events, trends and changes in society. They are therefore particularly useful as keywords, and typically less ambiguous than single words. We illustrate in Section 3 how advanced visualization tools allow us to explore these trends interactively.
We have used a probabilistic dependency parser, Pro3Gres (Schneider 2008), which is quite fast (the BNC parses in 24 hours) and which has been evaluated on several genres and varieties (Haverinen et al. 2008, Lehmann & Schneider 2009, Schneider & Hundt 2009), and on diachronic texts (Schneider et al. 2015). The grammar can be adapted manually to genres and varieties. The parser is suitable for parsing different varieties of English due to its robustness. For example, it does not enforce subject-verb agreement, it allows zero-determiners everywhere, and it uses statistical preferences instead of strict subcategorization frames. The parser outputs intuitive dependency relations. A subset of them is given in Table 2.
| Relation | Label | Example |
|---|---|---|
| verb–subject | subj | he sleeps |
| verb–direct object | obj | sees it |
| verb–second object | obj2 | gave (her) kisses |
| verb–adjunct | adj | ate yesterday |
| verb–subord. clause | sentobj | saw (they) came |
| verb–pred. adjective | predadj | is ready |
| verb–prep. phrase | pobj | slept in bed |
| noun–prep. phrase | modpp | draft of paper |
| noun–participle | modpart | report written |
| verb–complementizer | compl | to eat apples |
| noun–preposition | prep | to the house |
Table 2. Important dependency relations that are output by Pro3Gres.
An evaluation of the performance on subject, object PP-attachment and subordinate clause relations, using the 500 sentence GREVAL gold standard (Carroll et al. 2003), is given in Table 3. Compared to other parsers, these rates are competitive (Schneider 2008). While some of the performance values may appear low at first sight, the following facts alleviate the impact of errors: first, only precision errors indicate a wrong assertion, while recall errors entail that an instance has been missed, the signal remaining unaffected. Second, errors are largely unsystematic, which means that the signal is weakened but skewed much less than by the error rate. Third, the performance on complements (which is what we need more for most applications) is better than on adjuncts.
| Subject | Object | PP-attachment | Clausal | |
|---|---|---|---|---|
| Precision | 92.3% (865/937) | 85.3% (353/414) | 76.9% (702/913) | 74.3% (451/607) |
| Recall | 78.0% (865/1095) | 82.5% (353/428) | 68.6% (702/1023) | 61.7% (451/731) |
Table 3. Performance of Pro3Gres on the GREVAL gold standard corpus.
Syntactic parsing is useful because it allows linguists to distinguish between words that are adjacent or close to each other by coincidence, and those which are adjacent or close because they are syntactically related. This gives one the appropriate data for modelling alternations as alternative syntactic configurations instead of just surface sequences.
First, we show applications which are widely used in the research communities of Corpus Linguistics, Data Mining and Visualization. They are web-based or off-the-shelf tools, which also users with little or no programming skills can apply.
Web-based corpus interfaces, e.g. Corpus Navigator, BNCWeb (Lehmann, Schneider & Hoffmann 2000) and Dependency Bank (Lehmann & Schneider 2012a) are developed at the University of Zurich, and have been used by researchers world-wide. They provide a web-based interface for querying large corpora, using both syntactic queries and regular expression queries. This allows users to conduct pilot studies with little effort, including linguists with no programming skills.
In addition to showing hits in an interactive KWIC view, Dependency Bank also compiles frequency tables automatically. Figure 1 shows a screenshot of the tool, providing the frequency of the progressive passive (e.g. is being eaten), which has been described as one of the few innovations of Late Modern English, and which is described as being more frequent and more acceptable in present day English (Aarts, López-Couso & Méndez-Naya 2012). As can be seen, the frequency of the progressive passive indeed increases, but it peaks around the middle of the 20th century, and is in fact slightly decreasing since. We searched for progressive passive with the following regular expression: (am|is|are|was|were|be)_VB.? [^_]+_VBG [^_]+_VBN, i.e. a verb followed by an -ing form and followed by a past participle.
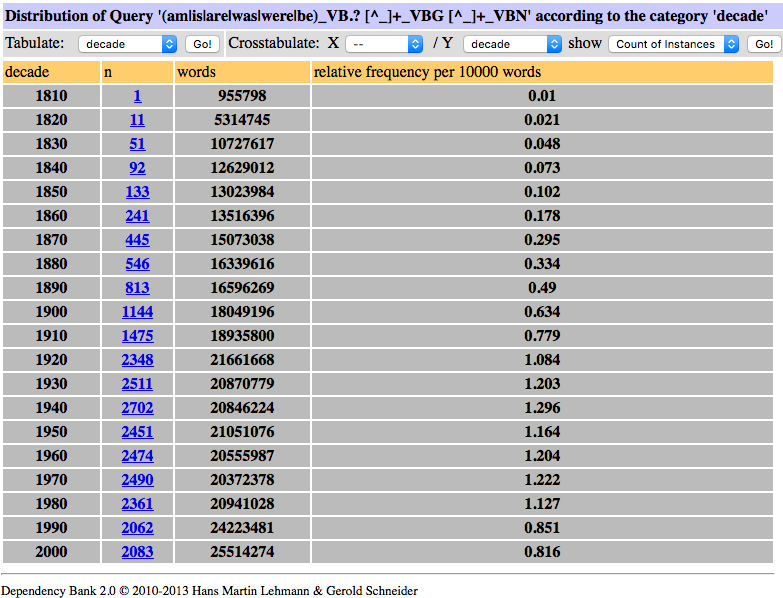
Figure 1. Frequency of progressive passive forms in COHA, raw numbers and relative frequency increases.
Concerning our phenomenon of noun compounds (Section 1.1.1), a search for noun-noun sequences allows one to immediately confirm the claim of Leech et al. (2009) that their frequency has drastically increased. This can be seen in Figure 2, which gives the frequencies of these compounds in the LOB family of corpora, as Leech et al. (2009) have done.
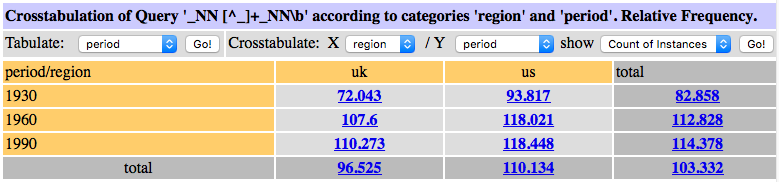
Figure 2. Frequency of noun-noun sequences in the LOB and Brown corpus family, from 1930 to 1990, increase in relative frequency.
The same trends can also be observed in COHA. The general increase of noun compounds is composed of very many individual changes. We can zoom in on them by for example focussing on those head nouns which seem to be particularly likely to act as heads of noun compounds. Figure 3 shows a query on COHA of compound nouns headed by system. The increase has already started in the 19th century, but its pace has accelerated in the 20th century, as Figure 3 shows.
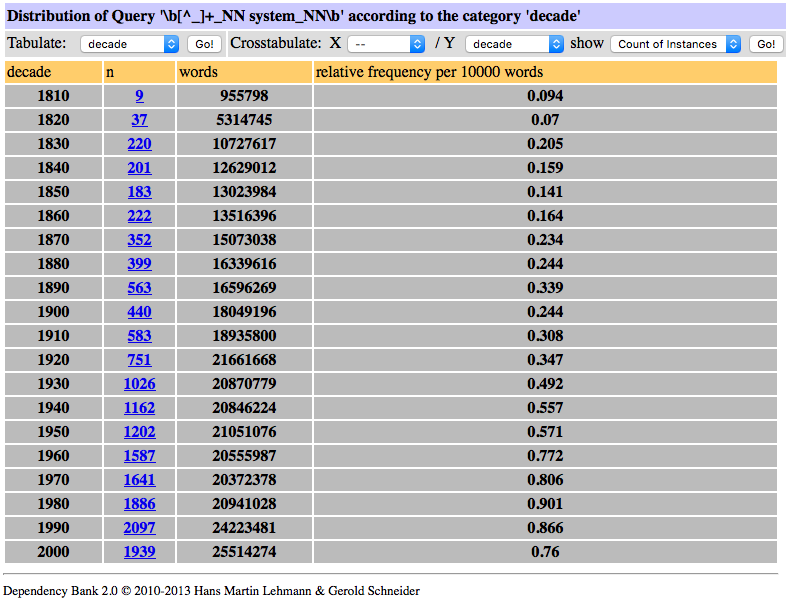
Figure 3. Frequency of noun-noun sequences headed by system in COHA.
The longer forms corresponding to these compounds, containing the noun system with syntactic modification by a PP, are decreasing slightly, as Figure 4 shows.
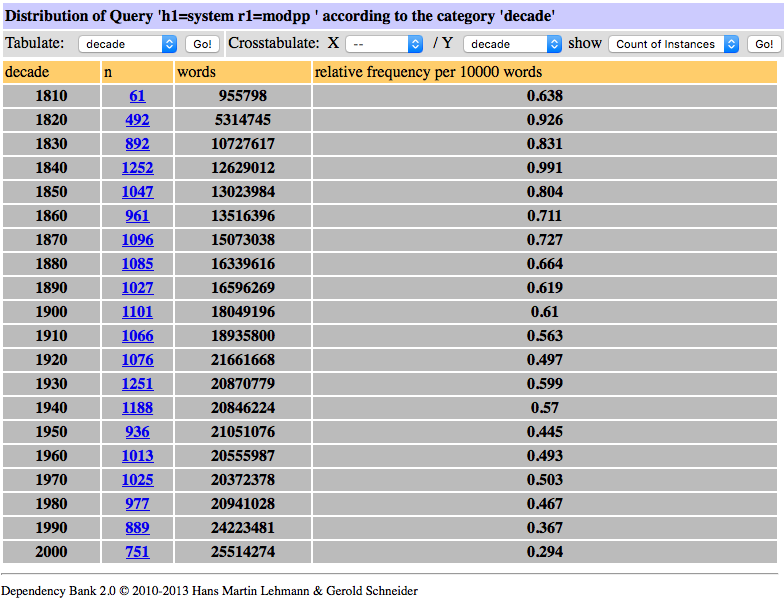
Figure 4. Frequency of noun-PP relations headed by system in COHA.
If we compare lexical modifiers, we see considerable differences between the noun compound modifiers, listed by decreasing frequency in Figure 5, and the modifiers in the form of prepositional phrases (PP), listed in Figure 6. We can see, for example, that school system tends to be a compound noun, while the PP-variant system of school is much lower ranked. On the other hand, system of government, the most frequent PP-form, is very rarely rendered as compound noun, government system in fact appears at rank 251, it occurs only 11 times in COHA. We will investigate the development of individual combinations in Section 2.3.
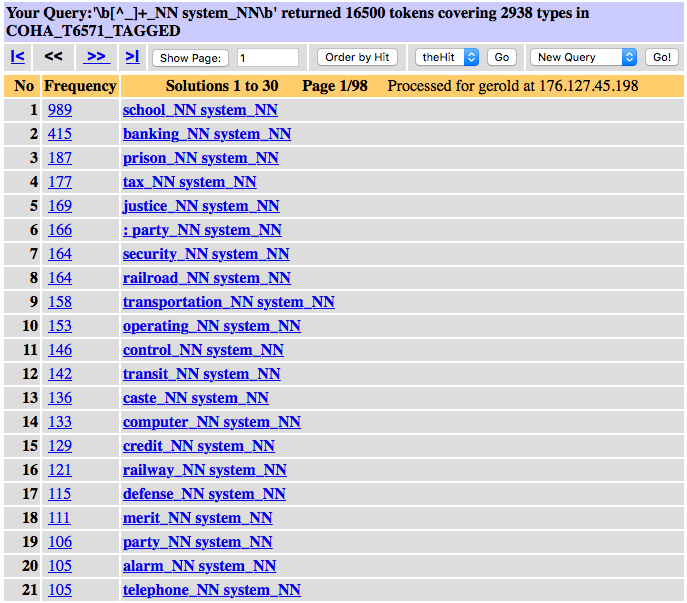
Figure 5. Modifiers in noun-noun sequences headed by system in COHA.
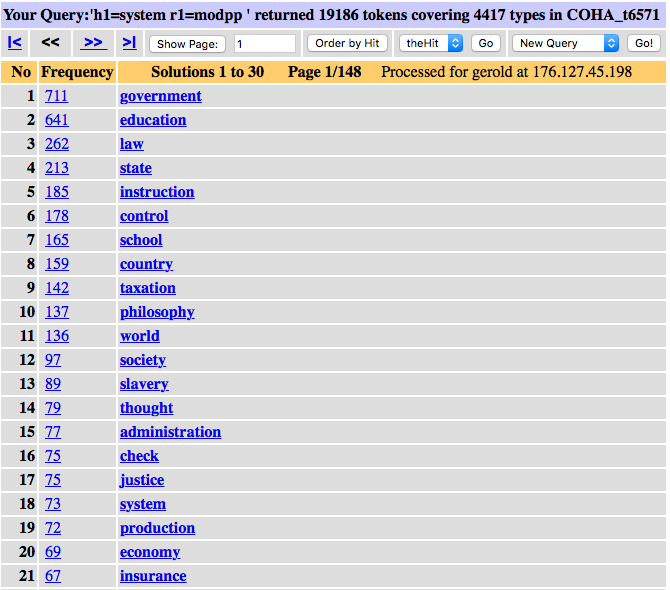
Figure 6. Modifiers of noun-PP relations headed by system in COHA.
In this section, we show that Machine Learning, in the form of document classification, is now available for the masses, in a user-friendly but powerful graphical interface. Programming skills are not necessary, although they facilitate the data preparation step. We illustrate the use of the simple, free document classification tool LightSide, which on the one hand determines if the data naturally splits into the classes to which the documents were manually assigned, and on the other hand delivers the features which differ most strongly, for example words that are overused, thus putting e.g. regression analysis (Gries 2010) for lexical overuse at the linguists’ fingertips. Regression is a class of algorithms from the large family of Machine Learning approaches, which we briefly introduce in the following.
Machine Learning approaches have a long tradition in Information Retrieval, which includes e.g. Google searches and spam filtering, but also in many other tasks. Smola & Vishwanathan (2008) give a technical introduction to Machine Learning. Manning, Raghavan & Schütze (2008) give a technical introduction to Information Retrieval. Manning, Raghavan & Schütze (2008: 100) introduce Information Retrieval generally as a document classification task: “To summarize, by viewing a query as a “bag of words”, we are able to treat it as a very short document. As a consequence, we can use the cosine similarity between the query vector and a document vector as a measure of the score of the document for that query. The scores can then be used to select the top-scoring documents for a query”. Any task that can be formulated as multivariate prediction based on a language model can be formulated as a document classification task.
Document classification generally works as follows: given a set of manually classified documents, the features that are characteristic of each class are automatically learnt from the documents in a corpus-driven fashion. All the features in combination form the language model. In the Machine Learning community, the term data-driven is more commonly used rather than corpus-driven, as the same type of approach can also be used for non-textual prediction tasks employing large amounts of data. Corpus-driven approaches allow us to investigate patterns of suspected overuse, be it between genres, varieties, sociolinguistic variables or time periods. The learnt features can then be used to classify new, previously unseen data. In an information retrieval scenario, there are two classes: each document is either relevant to a query, or it is not. In our linguistic application, the classes are genre, variety, etc. If the language model manages to predict the genre, variety (or whichever sociolinguistic variable we focus on) correctly in the vast majority of cases, then the predicting features of the model are meaningful and can be used as an accurate characterization.
We saw that the task of document classification is generally to assign each document to a class. A document can be a newspaper article, a web page, a book, a paragraph, a tweet, or a similar discourse unit. Classes can for example be broad topics, the binary classes of relevant or irrelevant document for an Information Retrieval task (see Jurafsky & Martin 2009: Chapter 23.1 or Manning & Schütze 1999: Chapter 25 for an introduction), an author in a forensic linguistic task (see Oakes 2014 for an introduction), or a positive or negative assessment of a political issue in automated content analysis (see Grimmer & Stewart 2013 for an introduction). In the majority of the implementations, the words in the documents are used as discriminators between the classes, typically without respecting their sequence or syntactic context, which is why the method is called a bag-of-words approach. Classes are either known, in which case they are typically learnt from a set of annotated documents in a training step, or similar documents are clustered together into the same class. Binary classification with known classes is used for very many tasks, for example spam filtering. Documents are usually represented in a vector space model (Salton 1971, Sahlgren 2006), which allows one to calculate document similarity with a simple cosine metric even if very many features are involved. Since every word type (as soon as it reaches a token frequency above a certain threshold) is a feature, there are often thousands of features. We used the default frequency threshold of 5, which for example in our study (Section 2.2.2) led to 6,182 features. Each feature in isolation is usually not a good discriminator between the classes, but many “weak” discriminators in combination can achieve a very high classification accuracy – we achieve above 99% correct classification in our following example study. There exist a range of algorithms for combining the features. The simplest approach, Naive Bayes, simply gives equal weight to each feature. More advanced approaches, for example logistic regression, which we use in the present study, give optimal weight to each feature. Features that are best predictors for the class are given the highest weights by the algorithm. The features with the highest weights are thus most characteristic for the class, and can thus be interpreted linguistically, as far as they are not due to skews in the underlying corpus.
As the classes can be at any level – linguistic, socio-historical, information-finding, forensic – document classification is also an approach for Digital Humanities tasks. Digital Humanities combine archiving, exploring and interpretation of texts with partly computational tools, involving experts from computing science, computational linguistics, corpus linguistics, literary science and history, see e.g. Schreibman et al. (2004) for an introduction.
In the simplest and most frequent task, we use binary classes: for example, documents are either relevant to a query or not, an email is either spam or not, a text is either from the scientific genre or not, a historical document either from the early or from the late period. Machine Learning has provided highly efficient and fast algorithms to research, as Smola & Vishwanathan (2008) summarize:
Binary Classification is probably the most frequently studied problem in machine learning and it has led to a large number of important algorithmic and theoretic developments over the past century. (Smola & Vishwanathan 2008: 9)
Except for the manual assignment of (binary) classes to documents, the extraction of features is completely driven by the content of the documents in our collection. In diachronic linguistics, corpus-driven approaches are relatively new and under-used. Hilpert & Gries (2016) describe the potential of these approaches as follows:
An attractive potential of quantitative corpus-based methods that has yet to be fully realized in diachronic studies lies in exploratory, bottom-up approaches (Gries 2010). The label ‘bottom-up’ stands for a set of techniques in which the data are processed statistically in order to discover structures that had not necessarily been anticipated by the analyst. […] [T]hese methods often reverse the order of qualitative and quantitative analysis. Whereas for instance a logistic regression analysis requires a fundament of qualitative analysis which is subsequently scrutinized statistically, bottom-up approaches may start with the statistical processing of raw data, which then yields results that function as a stepping stone for a qualitative analysis. Starting with automated computational procedures has the benefit of a ‘fresh start’ that may serve to eliminate preconceptions and to reveal previously overlooked aspects of a given phenomenon. (Hilpert & Gries 2016: 44–45)
For our example study, we again use a POS-tagged version of COHA, like in Section 2.1, but this time to detect diachronic changes in lexis in a data-driven fashion. In order to avoid genre imbalances, we concentrate on the genre of news. We have created two sets of documents of roughly equal size, each containing a little over 5,000 documents, one set comprising the earliest news documents (all COHA news texts from 1860 to 1899), the other set comprising the newest news documents (all COHA news texts from 1980 to 1999). We use document classification to test if each of the documents can be classified correctly into its period, using all lexical items appearing at least 5 times as features.
After converting the input text into a comma-separated format (CSV, easily created in e.g. Excel or OpenOffice), where one column contains the category to be classified, and the other column the entire text of the document, it can be loaded into LightSide. Figure 7 shows that we want to predict the Century (18 for the texts from 1860 to 1899, and 19 for the texts from 1980 to 1999) as a nominal category, based on the Text column. We have selected single words as features (Unigrams). Figure 7 shows that 49,538 unigram features were extracted, each corresponding to one of the 49,538 word types that appear at least 5 times (Rare Threshold).
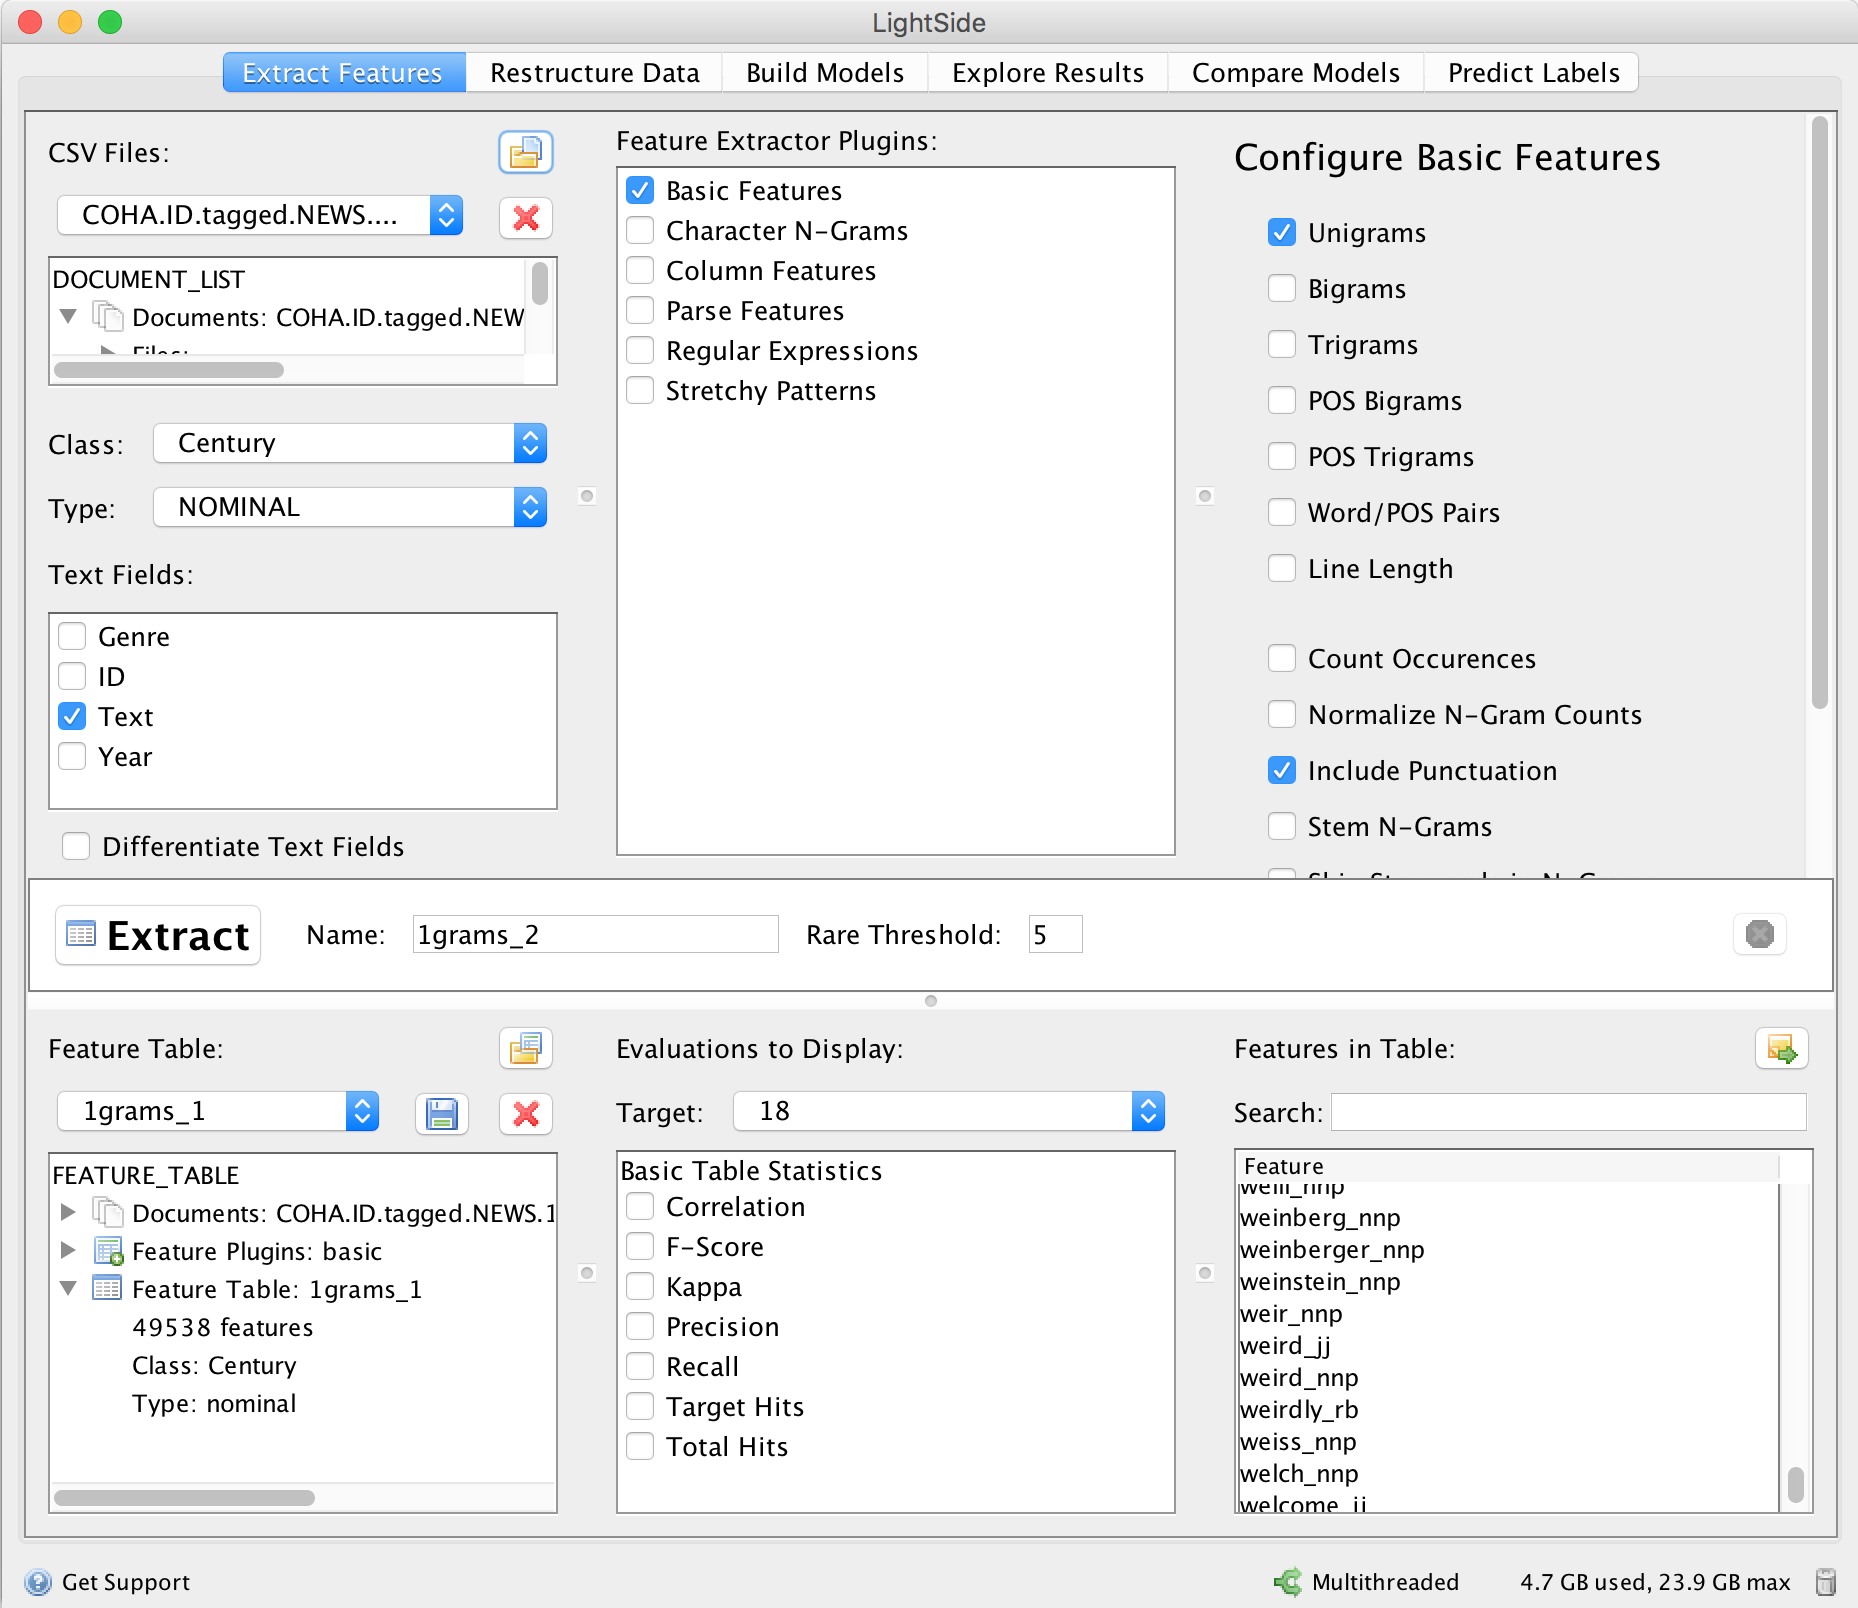
Figure 7. LightSide extracted 49,538 unigram features.
In the next step, we build a document classifying model based on the features that we have selected. LightSide allows one to choose from a large number of powerful, state-of-the-art machine learning algorithms, from Naive Bayes to Logistic Regression and the Kernel method (Support Vector Machines). The LightSide Manual gives a brief summary of the algorithms and of Machine Learning. As LightSide is a Weka wrapper, Weka configurations can be chosen as well. Even cross-validation is carried out automatically, making sure that the models do not overfit the data. The training phase can easily take between several minutes to hours, depending on the size of the data and the number of features, and may require a fast, recent computer. For testing, it is recommendable to start with a small number of features (100 to 10,000) for example by selecting a very high Rare Threshold, as high memory demands can easily crash the entire operating system, requiring a restart. During training, if the Multithreaded option is selected, all available processors are used, which means that the computer is completely occupied and hardly usable for other tasks in the meantime.
Figure 8 shows that our choice of logistic regression leads to 99.78% correct prediction accuracy. As the Model Confusion Matrix shows, only 9 early documents were misclassified as late, and only 16 late documents were misclassified as early.
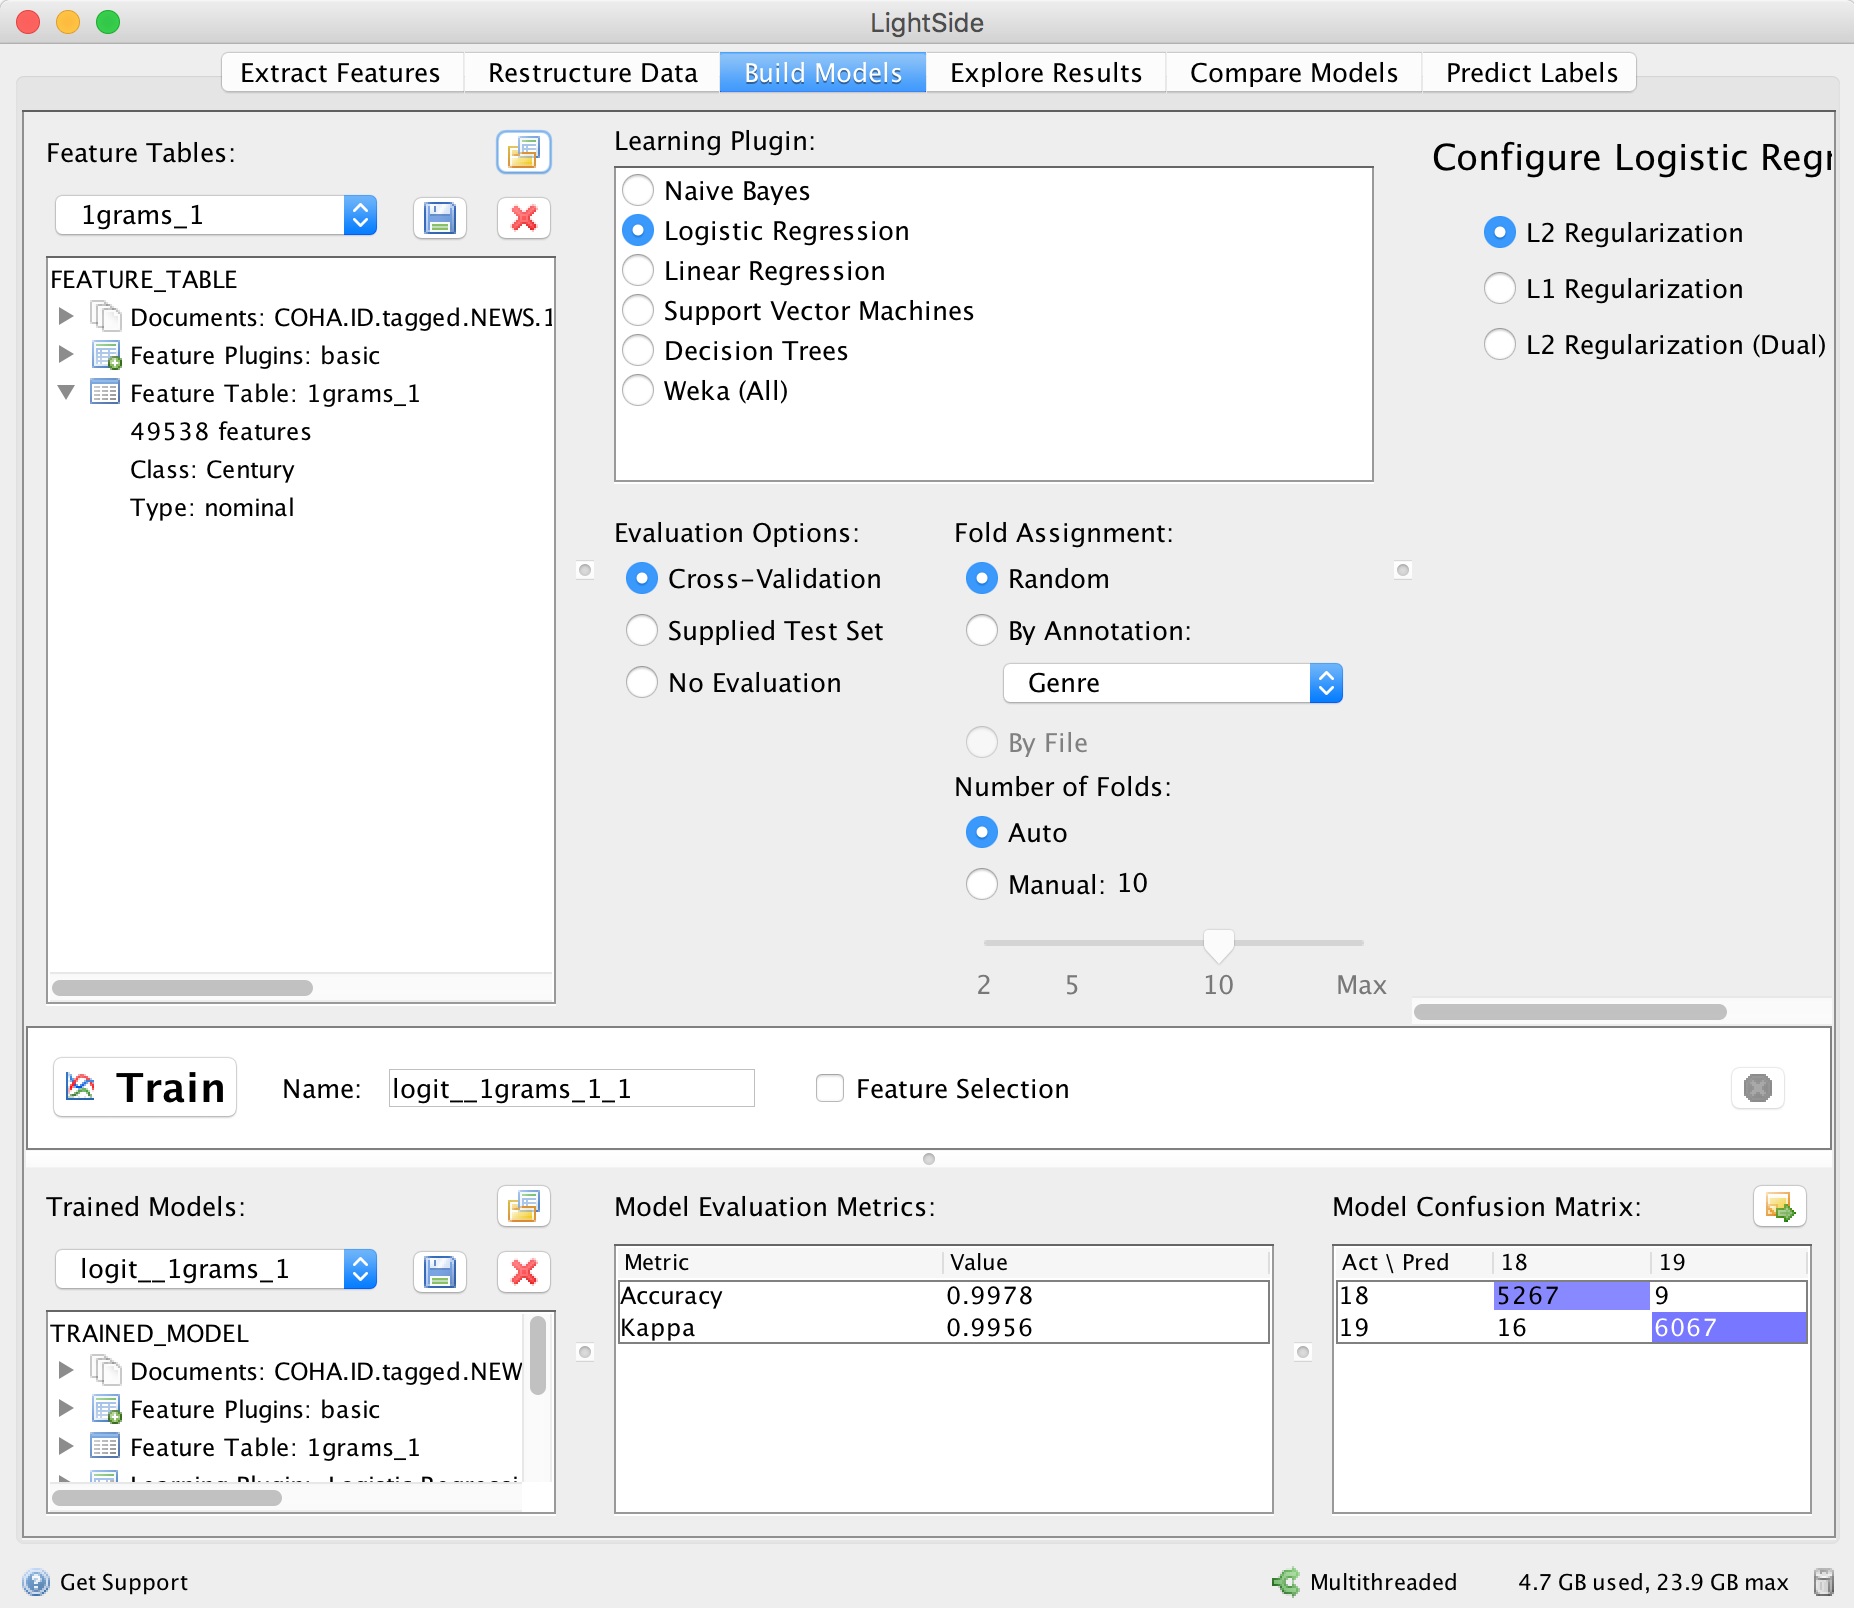
Figure 8. For building models, users can choose between many state-of-the-art machine learning approaches.
LightSide also allows one to investigate the classification errors. The bottom of Figure 9 shows the labels which the model predicts, in orange if the prediction is wrong. The document shown in orange here has been misclassified as a late text. For human readers, the second sentence In witness whereof I have hereunto set ... seems to be a good indicator of an early text. However, both hereunto and the present mistagged form of whereof occur less than 5 times in the document collection.
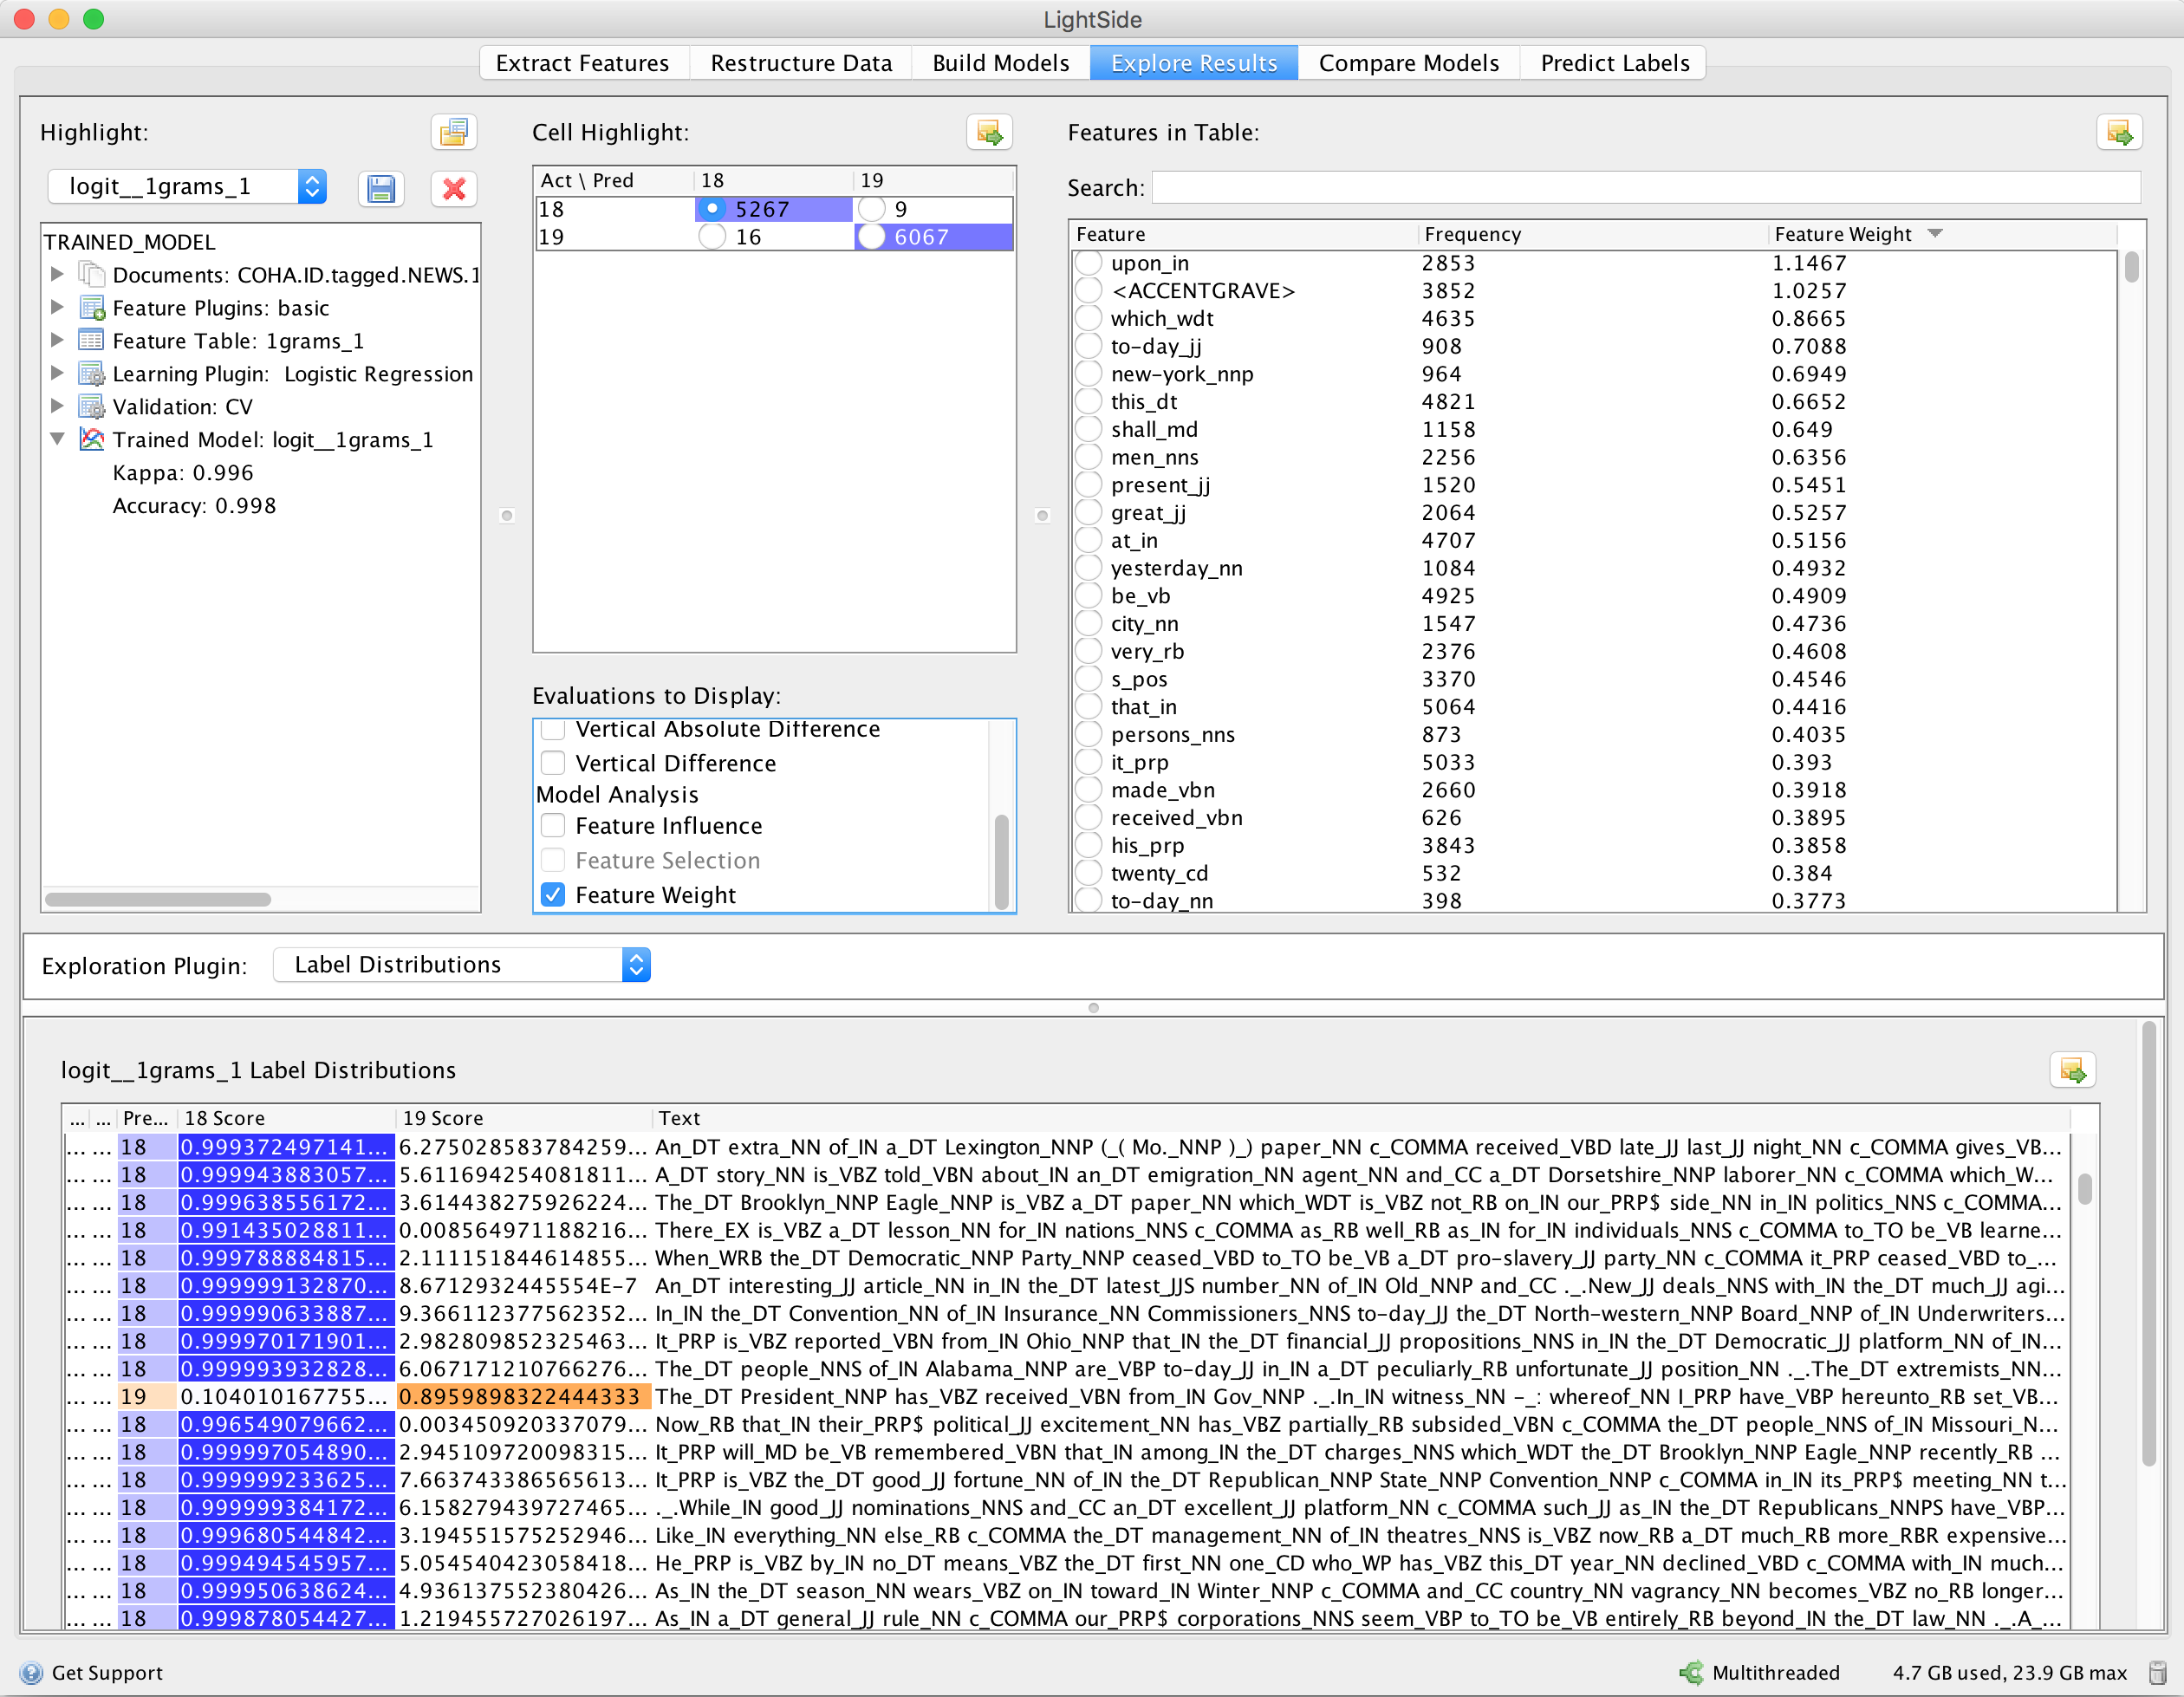
Figure 9. Exploration of results: overview of the strongest features (top) and error analysis (bottom).
The top of Figure 9 shows the unigram features, sorted by weight. For linguists, this is one of the most interesting results, telling us in a data-driven fashion which words are most indicative, i.e. typical of which category. The strongest feature for the early period is upon, followed by the accent grave symbol, then to-day spelled with a hyphen. Some of the features are not easily explainable, but many are convincing indicators. The list of the 1,000 features with highest feature weight for the early period (1860–1899) is given in Table 4, the list for the late period (1980–1999) in Table 5.
Table 4. Top 1,000 unigram features indicating the COHA early period (1860–1899).
Download the .xlsx file
Table 5. Top 1,000 unigram features indicating the COHA late period (1980–1999).
Download the .xlsx file
The late period features, among others, contain contractions (s, n, t, re), political entities and acronyms (U.S.), first- and second-person pronouns linked to more involved presentation styles (I, you), shifts in important topics (university, security) but also different ways of referring (problem, while in the early texts matter was ranked very high).
Once numerical data has been extracted, it is typically aggregated and then presented in Excel or R graphs. We now show the use of an animated visualization, GoogleVis, which is particularly effective for showing development over time (see also Hilpert 2011). To create these visualizations, basic programming skills in R are required. The aggregation step depends on the task at hand, and also requires basic programming skills or advanced Excel skills. For example in R, the command table allows one to convert raw data into frequency tables, as e.g. shown in an example from cyclismo.org at University of Georgia.
We have used the R package googleVis (Gesmann & de Castillo 2011) to create the following visualization. We illustrate the increasing tendency to shift from longer forms involving a preposition (e.g. member of board or room at a hotel) to its corresponding noun compound form (e.g. board member or hotel room).
In Section 2.2, we used document classification based on word frequency features (such as relative frequency or TF-IDF). While such approaches perform well at the level of the document, i.e. predicting the class of a document, they make a number of assumptions, which makes them less suitable for many intra-document tasks, for example predicting individual words or constructions. The most problematic assumption involves the bag-of-words model: words are counted irrespective of their structural or sequential context, which makes the absurd assumption that words are not ordered, but just a set. This makes it for example impossible to use such models to predict a word given a sequence. A word prediction would only respect the relative frequency of the word. But when speakers choose words, the previous context is crucial. A further problem is that the choices that speakers make do not happen at the word-level, but involve a complex interplay of words and structures, as e.g. construction grammar postulates. For word-level predictions, it is therefore important to model the choice always with respect to an appropriate set of alternatives, given the context.
This insight was already formulated by Labov (1969) in what he called the principle of accountability, also often referred to as the envelope of variation, which states
that any variable form (a member of a set of alternative ways of “saying the same thing”) should be reported with the proportion of cases in which the form did occur in the relevant environment, compared to the total number of cases in which it might have occurred. (Labov 1969: 738)
A class of clearly defined structural alternatives are for example syntactic alternations. Levin (1993) distinguishes 79 different alternations for English verbs. Coming back to our investigation of noun compounds (Sections 1.1.1 and 2.1) we model the choice between prepositional form and compound noun as alternation, as it has been described for the dative shift (e.g. Bresnan et al. 2007, Lehmann & Schneider 2011), the Saxon Genitive (Röthlisberger & Schneider 2013) or the passive form (Hundt et al. 2016).
We plot the relative frequency of the form with preposition against the noun-compound form, leading to a one-dimensional relation. The noun combinations at the top left corner exclusively occur in the noun-compound form (e.g. stone wall already does so in 1800), the noun combinations in the bottom right corner exclusively in the long form with a preposition (e.g. rate of interest is much more frequent in 1800 than its counterpart interest rate). We can see the most frequent noun-combinations in COHA, as one after another crosses over from the long form to the compound form. At the end of the time span, most of the forms that are more frequently used in the long form are either not synonyms, thus requiring semantic specification (such as coffee cup vs. cup of coffee, or art work vs. work of art), or they are even more frequently used in a one-word form (such as businessman or roadside).
To build similar visualizations, you can proceed as described in the following. Martin Hilpert’s motion chart website gives further exciting examples and hints.
First, the data needs to be arranged in a tabular format, simply using a TAB character between each column, and a RETURN character for each line. This format can also easily be generated in Excel, by saving as tabulator-separated text. The table which we have used in our GoogleViz visualization is: (download the .txt file here)
Resource 1. Data file for visualization, as link for saving (above) and inline (below).
Download the .xlsx file
The file is a raw text file, you can browse it in Resource 1. Second, in order to load it into R, the following command can be used, assuming that you already are in the correct folder.
NNPP <- read.csv(file="NNPP_for_googleVis_manuedit.tab.txt",sep="\t")
Third, we need to load the GoogleVis library and create the GoogleVis object, with the following commands (the first one only needs to be executed if you have not yet installed the GoogleVis library on your R system).
install.packages(googleVis)
library(googleVis)
NNPPplot <- gvisMotionChart(NNPP,idvar="WORD",timevar="DECADE")
Finally, executing the following R command will open the interactive visualization in your default web browser.
plot(NNPPplot)
An embedded version of the visualization is given as Resource 2.
Resource 2. Motion chart visualisation.
The above embedded visualization allows the user to interact with the animation in limited ways. For example, a user may select specific labels to be displayed, he or she may jump to a particular point in time, change the display axis, etc.
For more complex data types, more flexible forms of interaction are desirable. We explore them in the following section.
We now present multiple interactive visualization approaches developed by the Data Analysis and Visualization Group at the University of Konstanz. We present two visualizations to explore data-driven methods that detect which documents belong to similar topics, and which topics are particularly important at certain times in history. The third visualization generates an overview for distant reading (Moretti 2013) using lexical chains, which allows researchers of digital humanities, linguistics or data mining alike to identify interesting patterns in the corpus and to zoom in on those.
We use visual analytics techniques to be able to identify patterns across hundreds of data records and explore the data to get a better understanding of our analysis problems. Visual analytics approaches combine the computing power of data mining and machine learning tools with the general knowledge, creativity, and perception of human analysts to generate knowledge harvesting both the automatic and manual strengths. Especially for text analysis, data is often ambiguous, incomplete, and holds complex relations that can only be modeled by an automatic system with limited accuracy. Visual Analytics proposes a tight integration of visual and automatic methods to bridge this semantic gap. We rely on human interaction to explore the data, generate hypotheses, steer the analysis, and interpret the results.
We have seen in Section 2.2 that one criticism of word-based document clustering is that its statistical assumptions are unrealistic in that the choice of words when generating language is not independent: it depends very much, on the one hand on the sequence, which we have partly addressed in Section 2.3; on the other hand it depends on the semantic content, which we address now.
A second possible criticism of word-based document classification is that this approach only detects differences at the word level; that it fails to abstract to higher levels. Semantic and thematic investigations would profit from an approach in which synonyms of words are recognized and treated together. Linguistic investigations going beyond morphology and syntax, for example pragmatics, stylistics, genre studies or content analysis, involve an important semantic component, for which the ability to abstract from words to concepts would be desirable. The mapping between words and concepts is not 1:1, however. On the one hand, the same word may refer to different concepts due to word-sense ambiguity, on the other hand different words are (near-)synonyms or semantically closely related.
One option for mapping words to concepts is to use rule-based systems like WMatrix (Rayson 2009). While this approach performs quite well on general newspaper texts, there are two problems: first, specific genres and historical texts often obtain unsatisfactory analyses, as many of the words have undergone strong semantic shifts, or are genre-specific terms. Second, particularly in technological genres, many terms are non-compositional multi-word units, for which mapping individual words to concepts is generally inappropriate. We address the second point in Sections 3.1.2 and 3.1.3, and the first one in the following.
As a second option for addressing the problem of mapping words to concepts, the contexts of words can be used, in a purely data-driven fashion. These so-called distributional approaches have the advantage that they do not depend on present-day uses, but also disadvantages that are typical of data-driven approaches: large amounts of data are required, and the results fully depend on the quality of the corpora. Distributional approaches can learn topics, concepts, and synonyms from purely distributional aspects of large text collections. The distributional hypothesis, which is typically attributed to Firth (1957) (it is sometimes also called the Firthian hypothesis) and to Harris (1968, 1970) states that “words with similar distributional properties have similar meanings” (Sahlgren 2006: 21), or in other words, that words which frequently co-occur are similar in meaning, that words which occur frequently in a document are closely related to its content, that words generally are largely defined by their context. Using frequency-derived measures of words and co-occurrences is neither a recent invention, nor a Computational Linguistics one. Central ideas of the distributional hypothesis can be traced back to Saussure’s différance. Topic Modeling has become a central approach for automated content analysis. A good introduction is given by Blei (2012).
We started off our investigation of compound nouns with a purely linguistic question: why does their frequency increase so much? We then learned in Section 2.3 that the general increase is due to hundreds or even thousands of lexicalization steps, converting a long form into a noun compound form. Compound forms are highly ambiguous, so that the semantic relationship between the two components is only discernible from the context, as e.g. Jespersen (1942) and Biber (2003) point out.
Compounds express a relation between two objects or notions, but they say nothing of the way in which the relation is to be understood. That must be inferred from the context or otherwise. (Jespersen 1942: 137)
These increasingly compressed styles of expression are at the same time less explicit in meaning. For example, noun-noun sequences can represent a bewildering array of meaning relationships, with no overt signal of the intended meaning. (Biber 2003: 179)
We suspect that as soon as a state of affairs described with a long form becomes frequent enough for people to automatically associate the function between the nouns, the noun compound ceases to be ambiguous even outside a clearly defined context: a new concept has been born, and with it a new compound noun, which is then ready to spread and increase in use. Both forms typically co-exist, and it can take several decades until the noun compound form is the less marked from. In the case of unemployment rate, for example, which was a very serious problem in the economic crisis of the early 1930s and possibly also played an important role in the advent of World War II, the long form stayed the dominant form until about 1960, and the short and long form are roughly equally frequent for over a decade, from 1945 to 1960. A different case is the concept of climate change, which spreads very fast, the tipping point being about 1980. It clearly lexicalizes, as the readings of climate change in the sense of a change of surroundings or holidays, which are dominant until 1970, disappear. The frequencies can be seen in the embedded Google N-gram View of Figure 10.
Figure 10. Google N-gram frequencies for climate change, unemployment rate, and their corresponding long forms.
According to Master (2003: 2), “noun compound is a grammatical structure in which nouns are linked together to indicate a new concept”. If this is so, then we can detect new concepts, or neologisms in English by tracing noun compounds.
It is well known in Information Retrieval research that multi-word units, such as compound nouns, play a special role: they are less ambiguous than single words, and they are particularly suitable for keywords, i.e. words that characterize the content of a document. In other words, the mapping from word to concept is almost one-to-one in multi-word units, unlike with other words, as the following quotes stress.
Multiword expressions (Sag et al. 2002) often offer a better unit of analysis than tokens. […] it is usually easier and more reliable to automatically group together pairs or triples of words that occur together more often than one would expect by chance. (Schwartz & Ungar 2015: 84)
There are some documents for which the most relevant keywords are monograms. For example a document on “Tiger”, “Sun”, “football”, etc. On the other hand, for documents on “Static web page” or “cricket world cup”, there is no mono-gram keyword which can give proper clue about the document. For this type of documents, bi-gram or tri-gram keywords best serve the purpose, thus mono-grams must not be included. (Das et al. 2013: 240)
Encouraged by the fact that compound nouns give us a handle on concepts, based on words, we set out to detect and explore topics in a data-driven fashion. Unfortunately, there are too many concepts in world history to get an easy overview. Fortunately, there are approaches that aim to map words and concepts to topics, which are generally known as Topic Models. Latent Dirichlet Allocation (LDA) (Blei et al. 2003) is such an approach.
The idea of LDA is explained in detail in Blei (2012). A topic is a cluster of words which often co-occur. Topic models use a generative probability model which describes the probability of generating the given words in certain topics, which are not fixed. Topic models maximize the Bayesian probability
p(topic | document) x p(word | topic)
In words: documents belong to topics with a certain probability (p(topic | document)), these topics generate words with a certain probability (p(word | topic)). The documents and words are given, the algorithm finds a configuration of topics which fits best, i.e. leads to the maximum probability for the actual words as they are found in the documents in a corpus, in our case COHA.
The calculations involved are very complex, so that using all the word tokens in COHA, even when setting a high frequency threshold, is out of reach for current algorithms such as LDA. We have managed to scale up to the entire news genre of COHA due to two crucial steps: first, we only use the noun compounds, which are on the one hand much rarer and on the other hand very precise key words. Second, we use an incremental algorithm which overcomes many of the complexity issues, Incremental Hierarchical Topic Models (El-Assady 2015).
To facilitate the exploration of the corpus and the constructed topic model, several statistical indicators are computed and visualized. The visualizations assist in exploring the underlying temporal trends of the data and its grouping into topic hierarchies. These help in answering questions like: How did news articles evolve over time? Which topics were most prominent at a certain period in history? Which trends are detectable in sub-topics of a selected theme? etc. Two examples of such visualizations are shown in Figures 11 and 12.
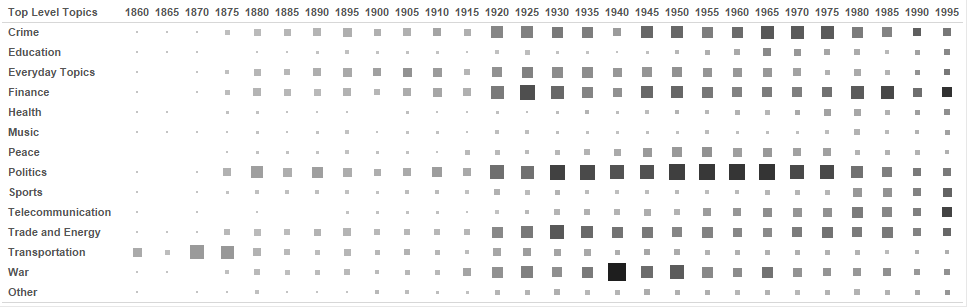
Figure 11. Heat Map View showing the number of documents per year and top-level topic. Through this visualization characteristic features of every time period are highlighted. Some events become quickly visible, e.g. the Second World War and the preceding financial crisis.
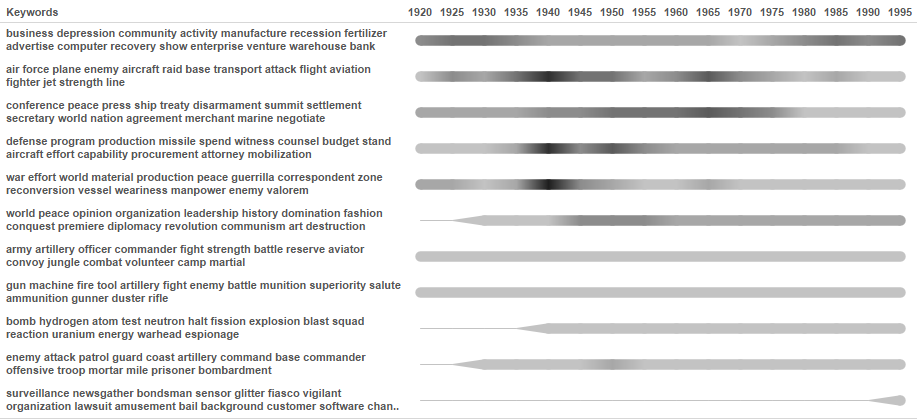
Figure 12. Density Chart highlighting the presence of topics of war and peace in the news section of COHA. This visualization emphasizes the peaks of each sub-topic (darker areas correspond to a higher density of news articles).
Below, we present a video that shows how users can interact with the statistical visualizations to answer different questions about the distribution of the data. Using these methods we can get first insights into the data to identify patterns and formulate hypotheses.
Video 2. Statistics visualizations for the complete COHA corpus. This video shows the interactive visualization dashboard designed using the Tableau software.
In the following, we describe the different visualizations displayed at every minute in the video.
This view is mainly used to explore the topic distribution over the course of the discussion. In this matrix visualization, each column represents one topic and each row represents one document. The cells where a topic is assigned to a document are colored with the color of the speaker/genre of this document. To facilitate the exploration, the height of each row is mapped to the length of the document it represents. The documents are ordered temporally, while the topics are ordered by their frequency or appearance-time in the corpus. The visualization displays speakers, genres and topic keywords upon hovering on a cell. The complete text of the document is shown on click. This visualization generates a compact overview on the topic-document relationships in a corpus allowing one to explore genres and periods.
In order to process the complete COHA corpus, we rely on the Incremental Hierarchical Topic Modeling (IHTM) algorithm (El-Assady 2015) as it requires only constant memory and generates a deterministic, stable result on linear datasets. Topics that evolve over time can be accurately captured using this algorithm and due to its scalability, the complete corpus can be processed in-memory which is not possible with other state-of-the-art algorithms. IHTM generates a topic hierarchy (since it does not require a parameter for the number of topics) and we use the top two levels of the hierarchy for the visualization.
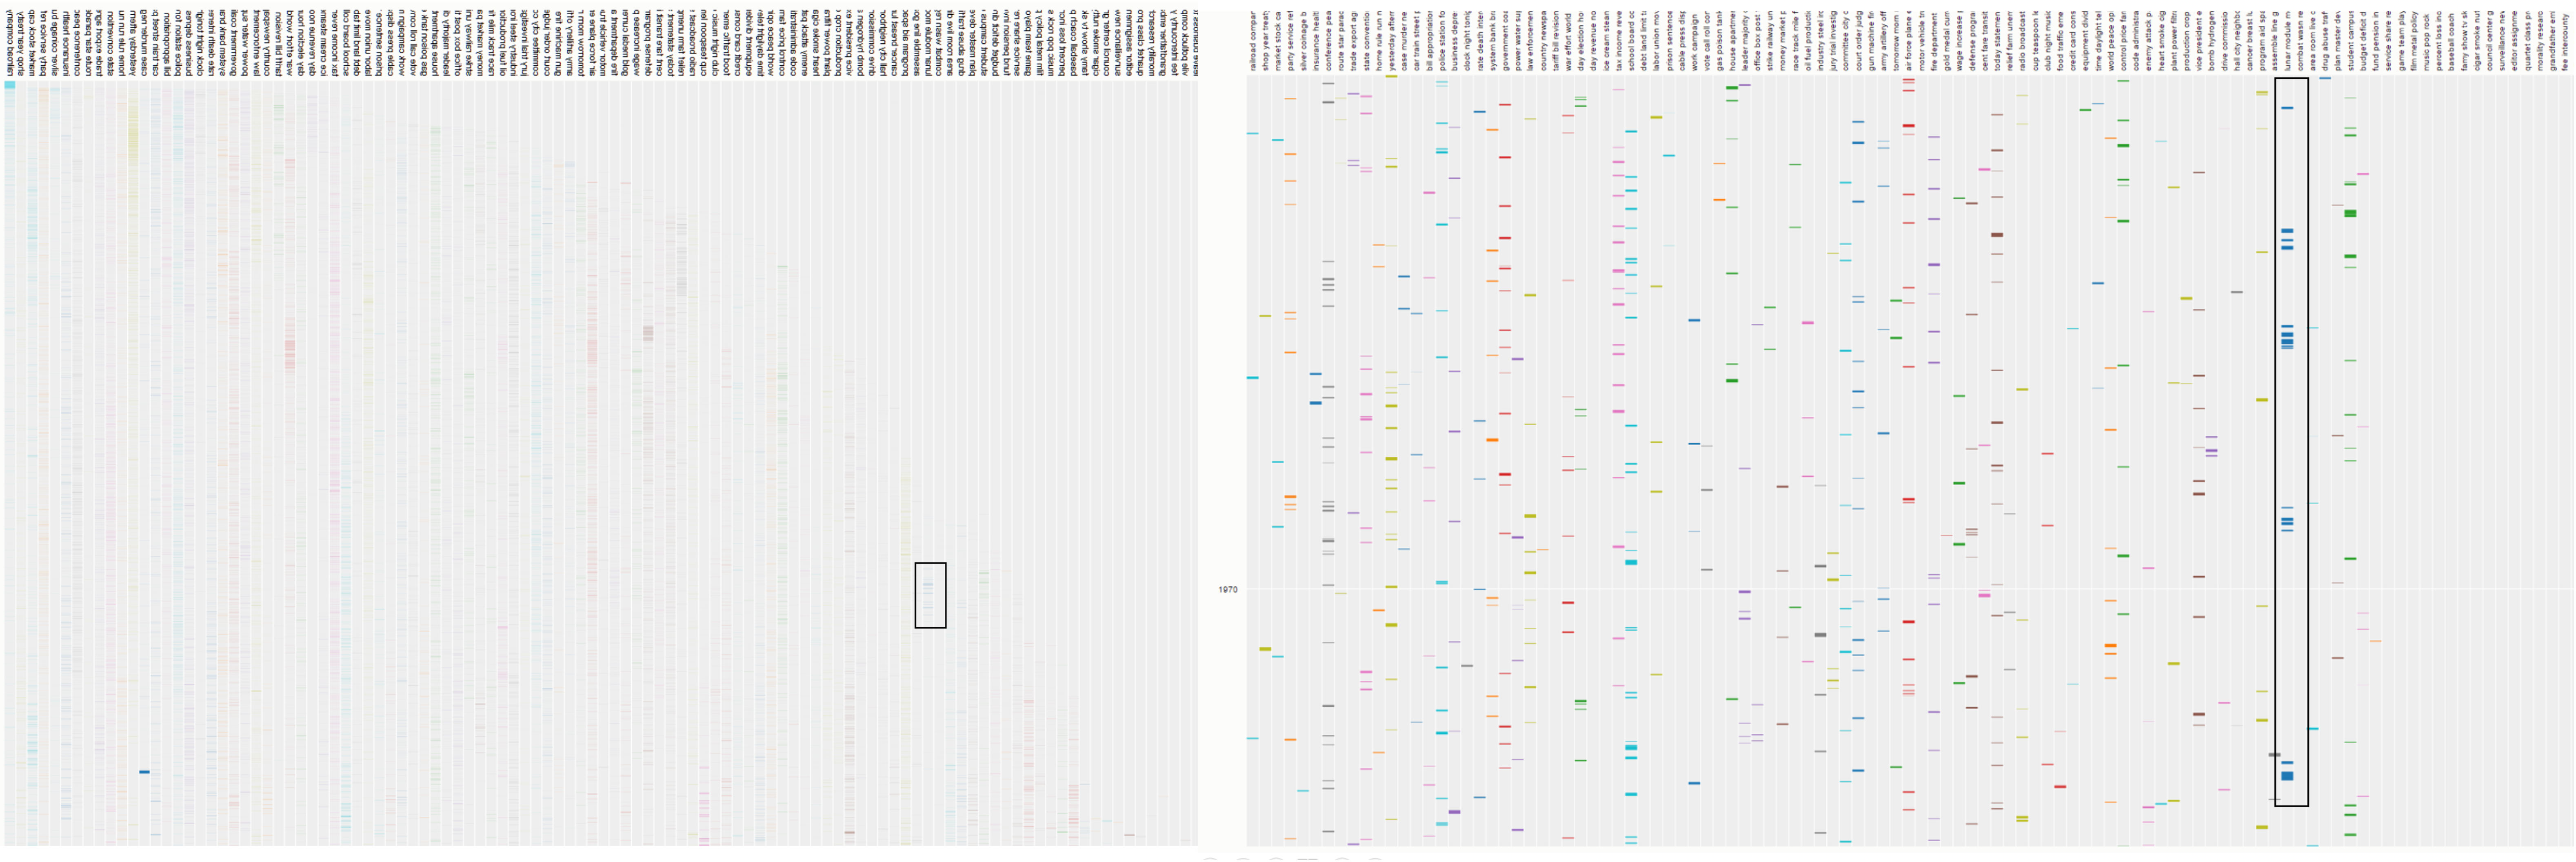
Figure 13. The topic with the key words lunar module moon orbit command flight space clearly identifies the American lunar missions in the early 1970s. The left image shows the overview of the complete time period we analyzed, the right image shows a zoomed-in view on the 1970s. Click on the figure for an interactive matrix visualization.
While it is difficult to evaluate the accuracy of the topic model, it allows users to browse the content of a large corpus, and in our case, learn a good bit about history. Figure 14 gives an example of three topics and the keywords found in them (each keyword is a participant in a compound noun, either as head or as dependent).
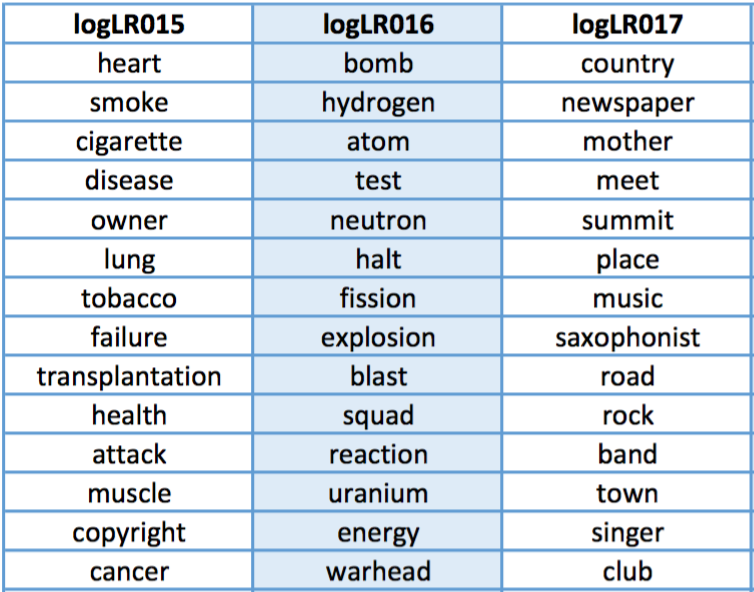
Figure 14. Three example topics.
In line with the concept of lexical chaining, Lexical Episodes are defined as the portion within the word sequence of a corpus where a certain word or feature appears more densely than expected from its frequency in the whole text. Lexical Episode Plots (Gold, Rohrdantz & El-Assady 2015) provide keywords at any level of detail from the text, from sentences to paragraphs to documents and time periods, allowing readers to find passages, documents or trends in society over periods of time. These plots create overviews of text corpora to enable a content-independent distant and close reading. On the complete corpus level, an overview of the most frequent episodes can be generated to identify content-related patterns and trends. When using linguistic features we can also track linguistic characteristics of genres such as complex noun phrases, and linguistic changes.
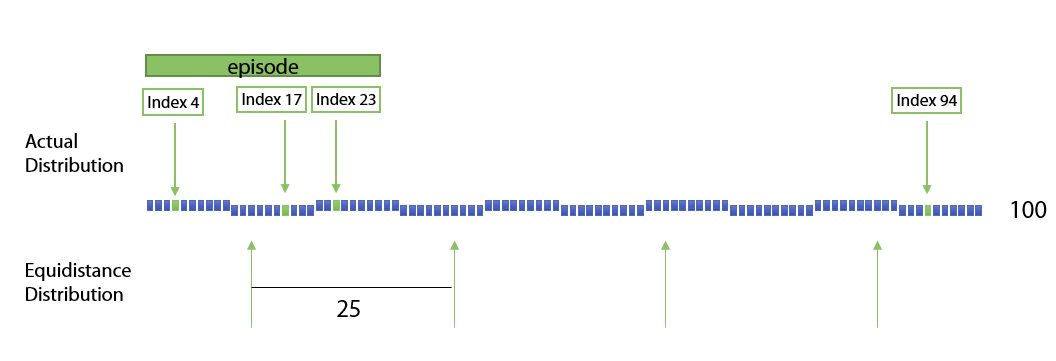
Figure 15. Lexical Episodes are defined as portions within the word sequence of a corpus where a certain word appears more densely than expected from its frequency in the whole text.
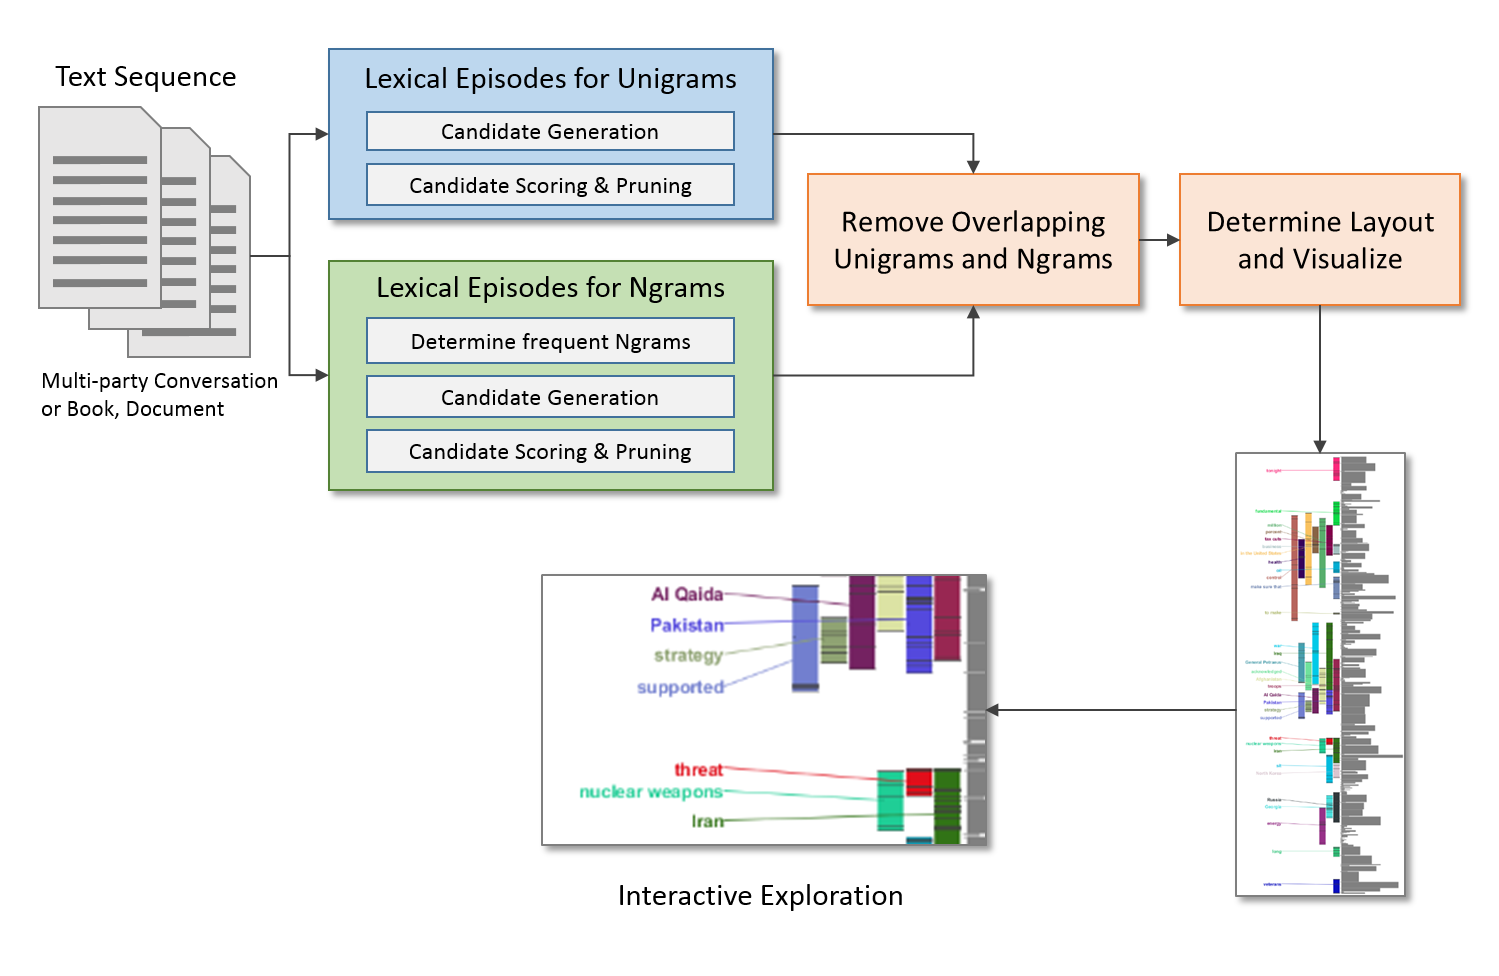
Figure 16. Pipeline for generating the Lexical Episode Plots visualization.
Lexical Episode Plots are generated using a statistical algorithm that extracts the episodes based on n-gram candidates and determines their positioning and ordering for the visualization. The video below shows the interaction with the visualization. This view was created based on data from the COHA corpus from 1930 to 1950. It shows portions of the text dealing with the financial deprivation that preceded the Second World War and topics of war and peace. Following the time of the war, we can find keywords like curfew or meat, food, and oil indicating the circumstances that people had to endure in the aftermath of the war. We also find an increasing number of peace initiatives in the years after the war.
We have shown several visualization tools, starting from simple tools that can be used by non-programmers up to current research on allowing researchers to create workflows from data to evidence, and to obtain an overview on big data. We have used the COHA corpus to illustrate the development of compound nouns, and then used their characteristic of creating new concepts and good keywords to explore trends and shifting topics in history and society from 1800 to 2000.
Although the main purpose of our paper is a demonstration of various methods for linguistic research, the methods that we have used have the potential for many other linguistic applications than those shown here. Syntactic analysis (Section 1) allows linguists to distinguish between those words that are adjacent due to coincidence, and those which are adjacent because they are syntactically related. This gives one the appropriate data for modelling alternations as alternative syntactic configurations (Section 2.3) instead of just surface sequences. Among other applications, this also gives us a more realistic base for measuring collocations, comparing against permutations inside a syntactic frame instead of unbounded permutations (see Lehmann & Schneider 2011).
Our machine learning application in Section 2 employs logistic regression to measure overuse of certain features when comparing two sets of documents. Instead of constraining the features, we have used all lexical features that are frequent enough not to be likely to be due to chance and report the ranked lists, as one typically does in collocation analysis. Logistic regression is a multivariate method, which makes sure that the complex interactions between the features are better respected than when just comparing single features (see e.g. Evert 2006). Like in collocation analysis, as soon as we are ready to trust the text (Sinclair & Carter 2004) strong overuses are due to a reason. The reasons may include corpus collection artefacts, but also the genre, synchronic, or sociolinguistic differences that we want to measure. If we use large amounts of data, increasingly more artefacts are typically evened out (see Keller & Lapata 2003, Lapata & Keller 2005). Instead of the lexical features which we have used, any other type of features can be used instead or in addition. They can also include sophisticated features such as syntactic, pragmatic, or semantic features (see e.g. Bresnan et al. 2007). In the Information Retrieval community, sophisticated features are still used relatively rarely, mainly because they typically add only very little performance for Information Retrieval tasks. Although adding a plethora of new features further and further violates statistical independence assumptions, in practice the classification performance does not suffer, because approaches such as logistic regression give very low weight to largely redundant features. If two features are completely redundant, however, the algorithm decides randomly which feature is given strong weight, but this too is more a theoretical concern than a practical problem. Any task that can be formulated as a document classification task can be addressed in this way.
While the sheer amount of words in a text may even out many violations of statistical assumptions, they stay problematic as soon as we use language models for predictions at more fine-grained levels, such as predicting words. The assumptions that words are independent of their context on the syntagmatic axis is addressed in Section 2.3, and the paradigmatic dependence is considered in the models used in Section 3. We have exploited the insight that noun compounds are semantically more specific in order to obtain reasonable topic models with only a fraction of all the word features, which has enabled us to get an overview of the entire COHA corpus.
A typical problem of data-driven methods is that they are difficult to evaluate. The high classification accuracy of the document classification in Section 2 is only an indicator that the approach works well, while the topic model approach in Section 3 is even more difficult to evaluate as no manually agreed gold standard exists. On the one hand the fact that we see trivially expected patterns such as war-related clusters in the period of World War II is a positive indication, on the other hand the exploration of results has also given us new insights. We plan to create a small gold standard in future research to be able to conduct systematic evaluations.
COHA = The Corpus of Historical American English: 400 million words, 1810–2009. 2010–. Compiled by Mark Davies. http://corpus.byu.edu/coha/. See the CoRD entry for COHA here: http://www.helsinki.fi/varieng/CoRD/corpora/COHA/
Data Analysis and Visualization Group at the University of Konstanz: http://www.vis.uni-konstanz.de/
LightSide platform: http://ankara.lti.cs.cmu.edu/side/. The manual: http://ankara.lti.cs.cmu.edu/side/LightSide_Researchers_Manual.pdf
LOB = The Lancaster-Oslo/Bergen Corpus. 1976. Project leader: Geoffrey Leech (project leader), Stig Johansson (project leader), Knut Hofland (head of computing), Roger Garside (head of computing, POS-tagged version). http://www.helsinki.fi/varieng/CoRD/corpora/LOB/
Martin Hilpert’s motion chart website: http://members.unine.ch/martin.hilpert/motion.html
R package googleVis: http://cran.r-project.org/web/packages/googleVis/index.html
Tableau software: http://www.tableau.com/
Tutorial example for converting raw data into frequency tables: http://www.cyclismo.org/tutorial/R/tables.html. The example comes from cyclismo.org at University of Georgia.
Weka: http://www.cs.waikato.ac.nz/ml/weka/
Aarts, Bas, María José López-Couso & Belén Méndez-Naya. 2012. “Late Modern English syntax”. Historical Linguistics of English: An International Handbook Volume I (Handbooks of Linguistics and Communication Science [HSK] 34.1), ed. by Alexander Bergs & Laurel J. Brinton, 869–887. Berlin: Mouton de Gruyter.
Biber, Douglas. 2003. “Compressed noun-phrase structures in newspaper discourse: The competing demands of popularization vs. economy”. New Media Language. London: Routledge.
Blei, David M. 2012. “Introduction to Probabilistic Topic Models”. Communications of the ACM 55 (4): 77–84. doi:10.1145/2133806.2133826
Blei, David M., Andrew Y. Ng, Michael Jordan I & John Lafferty. 2003. “Latent Dirichlet allocation”. Journal of Machine Learning Research 3: 993–1022. http://www.jmlr.org/papers/volume3/blei03a/blei03a.pdf
Bresnan, Joan, Anna Cueni, Tatiana Nikitina & Harald Baayen. 2007. “Predicting the Dative Alternation”. Cognitive Foundations and Interpretation, ed. by Gerlof Boume, Irene Kraemer & Joost Zwarts, 69–94. Amsterdam: Royal Netherlands Academy of Science.
Carroll, John, Guido Minnen & Edward Briscoe. 2003. “Parser evaluation: Using a grammatical relation annotation scheme”. Treebanks: Building and Using Parsed Corpora, ed. by Anne Abeillé, 299–316. Dordrecht: Kluwer.
Das, Bidyut, Subhajit Pal, Suman Kr. Mondal, Dipankar Dalui & Saikat Kumar Shome. 2013. “Automatic keyword extraction from any text document using n-gram rigid collocation”. International Journal of Soft Computing and Engineering (IJSCE) 3(2): 238–242. https://www.researchgate.net/profile/Bidyut_Das7/publication/272674061_Automatic_Keyword_Extraction_From_Any_Text_Document_Using_N-gram_Rigid_Collocation/links/54eafeb70cf27a6de1158374.pdf
El-Assady, Mennatallah. 2015. Incremental Hierarchical Topic Modeling for Multi-Party Conversation Analysis. Master’s thesis, University of Konstanz.
Evert, Stefan. 2006. “How random is a corpus? The library metaphor”. Zeitschrift für Anglistik und Amerikanistik 54(2).
Firth, John Rupert. 1957. “A synopsis of linguistic theory 1930–1955”. Studies in Linguistic Analysis, 1–32. Oxford: Philological Society.
Gesmann, Markus & Diego de Castillo. 2011. “Using the Google Visualisation API with R”. The R Journal 3(2). https://journal.r-project.org/archive/2011-2/RJournal_2011-2_Gesmann+de~Castillo.pdf
Gold, Valentin, Christian Rohrdantz & Mennatallah El-Assady. 2015. “Exploratory text analysis using lexical episode plots”. Eurographics Conference on Visualization (EuroVis) - Short Papers. The Eurographics Association. doi:10.2312/eurovisshort.20151130.
Gries, Stefan Th. 2010. “Methodological skills in corpus linguistics: A polemic and some pointers towards quantitative methods”. Corpus Linguistics in Language Teaching, ed. by Tony Harris & María Moreno Jaén, 121–146. Frankfurt: Peter Lang.
Grimmer, Justin & Brandon M. Stewart. 2013. “Text as data: The promise and pitfalls of automatic content analysis methods for political texts”. Political Analysis 21(3): 267–297.
Haverinen, Katri, Filip Ginter, Sampo Pyysalo & Tapio Salakoski. 2008. “Accurate conversion of dependency parses: Targeting the Stanford scheme”. Proceedings of Third International Symposium on Semantic Mining in Biomedicine (SMBM 2008), ed. by Tapio Salakoski, Dietrich Rebholz-Schuhmann & Sampo Pyysalo, 133–136. Turku: Turku Centre for Computer Science (TUCS).
Harris, Zellig. 1968. Mathematical Structures of Language. New York: Wiley.
Harris, Zellig. 1970. “Distributional structure”. Papers in Structural and Transformational Linguistics, ed. by H. Hiz, 775–794. Dordrecht: D. Reidel.
Hilpert, Martin. 2011. “Dynamic visualizations of language change: Motion charts on the basis of bivariate and multivariate data from diachronic corpora”. International Journal of Corpus Linguistics 16(4): 435–461. http://members.unine.ch/martin.hilpert/MCBM.pdf
Hilpert, Martin & Stefan Th. Gries. 2016. “Quantitative approaches to diachronic corpus linguistics”. The Cambridge Handbook of English Historical Linguistics, ed. by Merja Kytö and Päivi Pahta, 36–53. Cambridge: Cambridge University Press.
Hundt, Marianne, Gerold Schneider & Elena Seoane. 2016. “The use of the be-passive in academic Englishes: Local versus global language in an international language”. Corpora 11(1): 31–63. doi:10.3366/cor.2016.0084
Jespersen, Otto. 1942. A Modern English Grammar on Historical Principles Vol. VI. Copenhagen: Munksgaard.
Jurafsky, Daniel & James H. Martin. 2009. Speech and Language Processing: An Introduction to Natural Language Processing, Speech Recognition, and Computational Linguistics. 2nd edition. Upple Saddle River, NJ: Prentice-Hall.
Keller, Frank & Mirella Lapata. 2003. “Using the web to obtain frequencies for unseen bigrams”. Computational Linguistics 29(3): 459–484.
Labov, William. 1969. “Contraction, deletion, and inherent variability of the English copula. Language 45: 715–762.
Lapata, Mirella and Frank Keller. 2005. Web-based models for natural language processing. ACM Transactions on Speech and Language Processing, 2:1:1-31.
Leech, Geoffrey, Marianne Hundt, Christian Mair & Nicholas Smith. 2009. Change in Contemporary English. A Grammatical Study. Cambridge: Cambridge University Press.
Lehmann, Hans Martin & Gerold Schneider. 2009. “Parser-based analysis of syntax-lexis interaction”. Corpora: Pragmatics and Discourse: Papers from the 29th International Conference on English Language Research on Computerized Corpora (ICAME 29) (Language and Computers 68), ed. by Andreas H. Jucker, Daniel Schreier & Marianne Hundt, 477–502. Amsterdam: Rodopi.
Lehmann, Hans Martin & Gerold Schneider. 2011. “A large-scale investigation of verb-attached prepositional phrases”. Methodological and Historical Dimensions of Corpus Linguistics (Studies in Variation, Contacts and Change in English 6), ed. by Sebastian Hoffmann, Paul Rayson & Geoffrey Leech. Helsinki: VARIENG. http://www.helsinki.fi/varieng/series/volumes/06/lehmann_schneider/
Lehmann, Hans Martin & Gerold Schneider. 2012a. “BNC Dependency Bank 1.0”. Aspects of Corpus Linguistics: Compilation, Annotation, Analysis (Studies in Variation, Contacts and Change in English 12), ed. by Signe Oksefjell Ebeling, Jarle Ebeling & Hilde Hasselgård. Helsinki: VARIENG. http://www.helsinki.fi/varieng/series/volumes/12/lehmann_schneider/
Lehmann, Hans Martin & Gerold Schneider. 2012b. “Syntactic variation and lexical preference in the dative-shift alternation. Studies in Variation, Contacts and Change in English, Papers from the 31st International conference on English language research on computerized corpora (ICAME 31), Giessen, Germany, ed. by Joybrato Mukherjee & Magnus Huber. Amsterdam: Rodopi.
Lehmann, Hans Martin & Gerold Schneider. Forthcoming.
Lehmann, Hans Martin, Peter Schneider & Sebastian Hoffmann. 2000. “BNCweb”. Corpora Galore. Analyses and Techniques in Describing English, ed. by John Kirk, 259-266. Amsterdam & Atlanta: Rodopi. http://dx.doi.org/10.5167/uzh-63508
Levin, Beth. 1993. English Verb Classes and Alternations: A Preliminary Investigation. Chicago: University of Chicago Press.
Manning, Christopher D., Prabhakar Raghavan & Hinrich Schütze. 2008. An Introduction to Information Retrieval. Cambridge: Cambridge University Press. http://www-nlp.stanford.edu/IR-book/
Manning, Christopher D. & Hinrich Schütze. 1999. Foundations of Statistical Natural Language Processing. Cambridge, MA: MIT Press.
Master, Peter. 2003. “Noun compounds and compressed definitions”. English Teaching Forum 41 (3): 2–25. http://americanenglish.state.gov/files/ae/resource_files/03-41-3-b.pdf
Moretti, Franco. 2013. Distant Reading. London: Verso.
Oakes, Michael P. 2014. Literary Detective Work on the Computer (Natural Language Processing Series 12). Amsterdam: Benjamins.
Rayson, Paul. 2009. Wmatrix: A web-based corpus processing environment. Computing Department, Lancaster University. http://ucrel.lancs.ac.uk/wmatrix/
Röthlisberger, Melanie & Gerold Schneider. 2013. “Of-genitive versus s-genitive: A corpus-based analysis of possessive constructions in 20thcentury English”. New Methods in Historical Corpora (Korpuslinguistik und Interdisziplinäre Perspektiven auf Sprache - Corpus linguistics and Interdisciplinary perspectives on language (CLIP)), ed. by Paul Bennet, Martin Durrell, Silke Scheible & Richard J. Whitt, 163–180. Stuttgart: Narr Francke Attempto.
Sag, Ivan A., Timothy Baldwin, Francis Bond, Ann Copestake & Dan Flickinger. 2002. “Multiword expressions: A pain in the neck for NLP”. Proceedings of the Third International Conference on Intelligent Text Processing and Computational Linguistics (CICLING 2002), ed. by Alexander Gelbukh, 1–15. Berlin: Springer. http://lingo.stanford.edu/pubs/WP-2001-03.pdf
Sahlgren, Magnus. 2006. The Word-Space Model: Using distributional analysis to represent syntagmatic and paradigmatic relations between words in high-dimensional vector spaces. Ph.D. thesis, Department of Linguistics, Stockholm University.
Salton, G. 1971. The SMART retrieval system: Experiments in automatic document processing. Upper Saddle River, NJ: Prentice-Hall.
Schneider, Gerold. 2008. Hybrid Long-Distance Functional Dependency Parsing. Doctoral thesis, Institute of Computational Linguistics, University of Zurich. doi:10.5167/uzh-7188
Schneider, Gerold & Marianne Hundt. 2009. “Using a parser as a heuristic tool for the description of New Englishes”. Proceedings of Corpus Linguistics 2009.
Schneider, Gerold, Hans Martin Lehmann & Peter Schneider. 2015. “Parsing Early and Late Modern English corpora”. Digital Scholarship in the Humanities 30(3): 423–439. doi:10.1093/llc/fqu001
Schreibman, Susan, Ray Siemens & John Unsworth, eds. 2004. A Companion to Digital Humanities. Oxford: Blackwell. http://www.digitalhumanities.org/companion/
Schwartz, H. Andrew & Lyle H. Ungar. 2015. “Data-driven content analysis of social media: A systematic overview of automated methods. AAPSS Annals 659: 78–94. http://wwbp.org/papers/dataDriven2015.pdf
Sinclair, John McHardy & Ronald Carter. 2004. Trust the Text: Language, Corpus And Discourse. London: Routledge.
Smola, Alex & S.V.N. Vishwanathan. 2008. Introduction to Machine Learning. Cambridge: Cambridge University Press.