Basic structure of the corpus
FRED-S spans a subset of FRED texts not subject to copyright restrictions. More specifically, FRED-S covers:
1,011,396 running words
c. 123 hours of recorded speech
121 interviews
144 dialect speakers
57 different locations, in 18 different counties, in 5 major dialect areas:
the Southwest and Southeast of England, the Midlands, the North of England, and the Scottish Lowlands
(the full version covers 9 major dialect areas, including also the Scottish Highlands, the Hebrides, Wales and the Isle of Man; 43 different counties; c. 300 hours of recorded speech; 372 interviews with 431 speakers)
The recordings
All conversations in FRED-S were recorded between 1970 and 2000, the majority in the 1970s and 1980s (see table below). The recording date and/or recording decade for each text are specified in the text header as <RECDAT year> and <RECDEC 3 digits decade reference>. Except for a few texts where the tape was interrupted or the recording stops before the actual end of the conversation, most recordings are full-length interviews which last between 30 and 90 minutes. The longest interview is KEN_003 with almost 4.5 hours and roughly 47,000 words.
Table 1. Text distribution by recording date, FRED-S.
recording date |
number of texts |
% of textual material |
1970 - 1979 |
47 |
42.2% |
1980 - 1989 |
56 |
43.9% |
1990 - 1999 |
15 |
10.3% |
unknown |
3 |
3.6% |
Total |
121 |
100.0% |
Geographic coverage - dialect areas, counties and locations
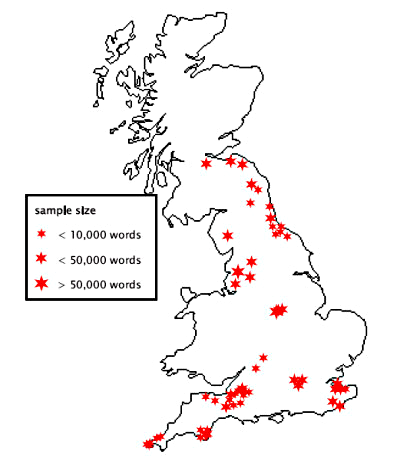
FRED can be used to investigate single regional varieties as well as for the cross-regional comparison of linguistic features. On the uppermost geographic level, the texts are divided into 5 major dialect areas; for a more fine-grained analysis, there is also information on the county and location where each interview was recorded. The dialect area, county and location for each text are specified in the text header as <area value>, <county value> and <location value>. The county of a text can also be inferred from the file name, which starts with a three-letter 'Chapman county code' followed by underscore and a running number (DEV_001, DEV_002, DEV_003, etc. would all be texts from Devon; see www.genuki.org.uk for the Chapman county codes).
Tables 2 and 3 show a breakdown by dialect area and county of the amount of textual material in FRED-S (excluding interviewer utterances). The dialect area, county and location of each text are also specified in both the FRED-S text list (table 4) and the FRED-S speaker list (table 5) below.
Table 2. Text distribution by dialect area, FRED-S.
dialect area |
number of texts |
running words |
% of textual material |
Southwest (SW) |
38 |
264,863 |
26.2% |
Southeast (SE) |
17 |
260,643 |
25.8% |
Midlands (Mid) |
16 |
152,535 |
15.1% |
North (N) |
30 |
266,955 |
26.4% |
Scottish Lowlands (ScL) |
20 |
66,400 |
6.6% |
Total |
121 |
1,011,396 |
100.0% |
Table 3. Text distribution by county, FRED-S.
county |
Chapman county code
|
dialect area |
running words |
% of textual material |
Cornwall |
CON |
SW |
26,535 |
2.6% |
Devon |
DEV |
SW |
79,870 |
7.9% |
Oxfordshire |
OXF |
SW |
13,801 |
1.4% |
Somerset |
SOM |
SW |
69,321 |
6.9% |
Wiltshire |
WIL |
SW |
75,336 |
7.4% |
Kent |
KEN |
SE |
155,192 |
15.3% |
London |
LND |
SE |
74,856 |
7.4% |
Middlesex |
MDX |
SE |
30,595 |
3.0% |
Leicestershire |
LEI |
Mid |
2,341 |
0.2% |
Nottinghamshire |
NTT |
Mid |
150,194 |
14.9% |
Durham |
DUR |
N |
26,507 |
2.6% |
Lancashire |
LAN |
N |
139,845 |
13.8% |
Northumberland |
NBL |
N |
27,777 |
2.7% |
Westmorland |
WES |
N |
21,304 |
2.1% |
Yorkshire |
YKS |
N |
51,522 |
5.1% |
East Lothian |
ELN |
SCL |
28,985 |
2.9% |
Midlothian |
MLN |
SCL |
21,068 |
2.1% |
West Lothian |
WLN |
SCL |
16,347 |
1.6% |

Figure 1. FRED-S areal coverage: locations of samples in the corpus.
Genre(s) covered by the corpus
FRED is a spoken-language corpus (audio recordings with orthographic transcripts). It consists of oral history interviews with native speakers of BrE; the conversations are spontaneous and informal.
|

