6 USES OF ENGLISH
In this section of the questionnaire (questions 26–35) we wanted to map out how and in what kinds of situations Finns use English in their free time and at work. The respondents were asked to consider even minor use, for example the use of single English words. The aim of this section was to map out differences between productive use (writing, speaking) and receptive use (reading, listening), and also between oral and written use (questions 27–30). As contexts for the use of English in free time we selected internet use and game-playing, on the basis of earlier studies (see Taalas et al. 2008; Luukka et al. 2008; Leppänen & Nikula 2007). As contexts for the use of English in working life we selected computer-mediated communication, reading professional literature, and customer contacts among others. In addition, the respondents were asked for their views on their personal English use, and their reasons for using English. Finally, we wanted the respondents to compare themselves as users of English and users of the mother tongue.
6.1 Results
The response rates varied by response group. Overall, the response rates were high, but respondents with primary education only were somewhat passive (55–60 %). This also applied to the responses in the oldest age group, where response rates of less than 70 % occurred.
6.1.1 Where English is used most
Question 26 asked respondents to indicate where they used English most. There were four options (at school or in my studies, in my free time, at work, and I do not use English), of which only one was to be chosen. The response distribution is shown in Figure 36. The majority of the respondents (52 %) indicated that they used English most in their free time. Approximately 9 % indicated that they did not use English at all.
No significant differences were found between the sexes (Table 26.1). Comparisons by age group revealed that in the youngest age group English was used most at school or in my studies, and second most in my free time. Among the other age groups English was used most frequently in free time with at work coming second, except for the oldest age group in which I do not use English was the second most common option (Table 26.2). The differences between the generations were considerable: the proportion of respondents not using English increased enormously from the two youngest age groups (2–5 %) to the oldest (30 %). In all areas of residence, free time was found to be more frequent as a context for English use than work. However, work was clearly a more common context in the cities (Table 26.3). Country dwellers indicated non-use of English more often than the others.
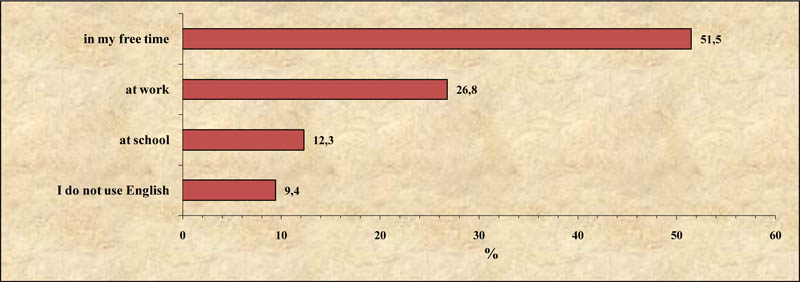
FIGURE 36 The place where English is used the most
Free time was found to be the most common context for English use irrespective of the respondent’s level of education (Table 26.4), but among those with a polytechnic or university degree, work emerged as almost as common. Respondents with a lower level of education more commonly indicated non-use of English, or else chose the option at school or in my studies. Among the occupations (Table 26.5), managers and healthcare workers stood out – each in their own way. Unlike the others, managers indicated a greater use of English at work (57 %) than in free time (32 %). Among healthcare workers the proportions for both free time (70 %) and studies (14 %) were exceptionally high. Only 6 % of the healthcare workers indicated that they used English most at work. The proportion of those not using English was highest among manual workers (16 %).
6.1.2 Listening to English in free time
Question 27 dealt with listening to English in free time. The respondents were asked to indicate on a five-point scale
(almost daily, about once a week, about once a month, less frequently, never) how often they listened to English in the following forms:
(a) music,
(b) subtitled films/TV programmes,
(c) speech programmes on the radio,
(d) films/TV programmes without subtitles.
For the sake of clarity, we have here (and in the Tables) divided the respondents into two groups: (1) those who listen to English at
least every week (i.e. almost daily or about once a week), and (2) those who listen to English less frequently. We present the
results as percentages of the more active group. This simplification does not lead to any loss of crucial information in our conclusions.
The percentages are presented in Figure 37 and in Tables 27.1–27.5.
Overall, 85 % of the respondents indicated that they listened to music in English at least once a week. Subtitled films/TV programmes were indicated by an even higher proportion of respondents (88 %). In the case of speech programmes on the radio, 9 % of the respondents indicated that they listened to such programmes in English at least once a week. The proportion of those listening to films/TV programmes without subtitles was 25 %.
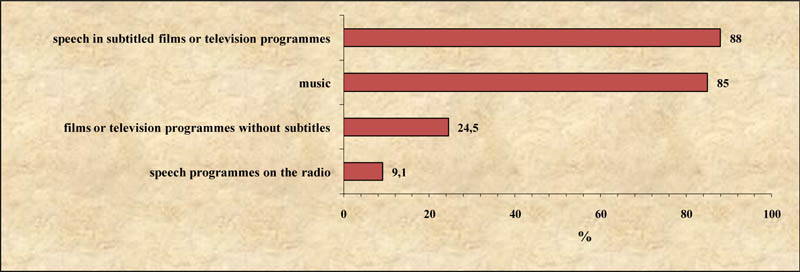
FIGURE 37 The percentages of the respondents who listen to English in different types of situations at least every week
In the case of listening to music in English (a), the clearest difference between background variables was, as expected, found with
respect to age groups: 97 % of the 15–24 age group said that they listened to music in English at least once a week. These proportions fell sharply in the older age groups, to only 50 % in the 65–79 age group. Among men (87 %) the proportion was slightly higher than among women (83 %). In the urban areas and rural centres the proportion was somewhat higher (about 87 %) than in the countryside (75 %). Respondents who had undergone only primary education showed a lower percentage than the rest (71 %, against at least 85 % for the other education groups).
Point (b) concerned listening to speech in subtitled films/TV programmes. No statistically significant differences were found
by gender or profession, but between other background variables the differences were clear. The activeness fell from the younger age groups
to the older ones. Furthermore, the rate was somewhat higher in the cities, towns, and rural centres (approximately 90 % in each) than in the countryside (79 %). Respondents with only primary education again differed from the others: the proportion of them listening at least once a week was 66 %, whereas in every other group it was around 90 %.
Listening to speech programmes on the radio (c) in English was overall fairly rare, and no statistically significant differences were
found by any background variable.
In the case of (d) films/TV programmes without subtitles, significant differences were found in all comparisons by background
variables. The most active listeners in this case were as follows: men (29 % at least once a week); the 15–44 age group (28–31 %); city dwellers
(29 %); and the most highly educated (27–30 %).
Differences between occupations were not statistically significant for options (a)–(c). For option (d) (listening to
speech in films/TV programmes without subtitles), the office and customer service workers differed from the others: they were the most active
(29 %), whereas healthcare workers (12 %) were the least active.
6.1.3 Reading in English in free time
Question 28 inquired if the respondents read English-language material of the following types in their free time:
(a) newspapers,
(b) magazines (general interest/hobbies),
(c) comics,
(d) literature,
(e) nonfiction/professional literature,
(f) manuals and product descriptions,
(g) e-mails,
(h) web pages (webzines; home pages).
The same five-point scale was used here as in question 27 (almost daily, about once a week, about once a month, less frequently, never). Because reading in English was generally less common than listening, the respondents are here divided into (1) those who read in English at least every month (i.e. about once a month or more frequently), and (2) those who read less frequently or never. The results are presented as percentage values of the more active readers (see 6.1.2 above, Figure 38; also Tables 28.1–28.5).
The results indicate that reading English was less common than listening to English. The largest percentages for reading in English at least
once a month were gained by web pages (56 %), manuals and product descriptions (48 %), and e-mails (43 %). The percentages for other printed materials were significantly lower.
Regarding all the text types in question 28, a good number of statistically significant differences were found by all the background variables. Men and women differed in all the text types (Table 28.1). Women were somewhat more active readers of literature, but in every other category men were more active. The greatest differences concerned reading English-language web pages, manuals and product descriptions, and e-mails.
Statistically significant differences were found between age groups for all text types (Table 28.2). The differences were clear, especially in relation to reading web pages, e-mails, and comics, in all of which the two youngest age groups (15–44) were significantly more active than the older ones. The results were similar concerning printed materials and literature, but in reading nonfiction/professional literature the 25–44 age group was clearly the most active age group. In the two youngest age groups the most frequently chosen text type was web pages, whereas in the older age groups the option manuals and product descriptions was chosen most frequently.
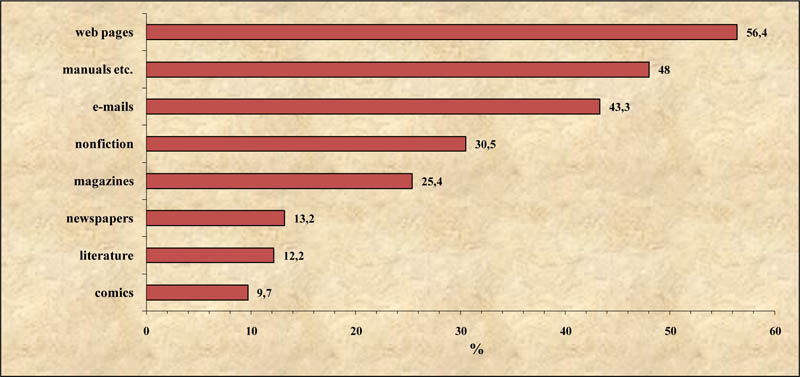
FIGURE 38 The percentages of the respondents who read English text in different types of situations at least every month
Differences between areas of residence were statistically significant for all text types, except for reading comics (Table 28.3); in this case reading in English consistently showed the highest frequency in cities and the lowest in the countryside. The most commonly read English-language material was web pages in all areas except for the countryside, where reading manuals and product descriptions was the most frequently chosen option.
Comparisons by level of education also showed consistent and statistically significant differences for all text types except for
comics (Table 28.4). As one would expect, respondents with the highest level of education did the most reading in English, and the least educated the least reading. Reading web pages in English was the most frequently chosen option (50–80 %) in all groups except for respondents with only primary education (20 %). Among the latter the proportion of respondents reading manuals and product descriptions in English was slightly higher (21 %).
Among the various occupations, managers and experts were the most avid readers of English in their free time, and healthcare workers the least. The differences were statistically significant for all text types except for reading comics (Table 28.5). In all groups, reading web pages in English was the most common reading activity. However, among manual workers, reading manuals and product descriptions was equally common. The proportion of those reading in English monthly was highest among managers, except regarding the literature category, where experts indicated a significantly higher frequency than managers.
6.1.4 Writing in English in free time
Question 29 concerned the extent to which respondents wrote in English in their free time. The respondents were asked to indicate on a five-point scale (almost daily, about once a week, about once a month, less frequently, never) how often they wrote the following English text types in their free time:
(a) letters, postcards,
(b) stories, poems,
(c) text messages,
(d) notes or other short messages,
(e) e-mails,
(f) on the internet (e.g. weblogs, discussion forums).
Again, we divided the respondents into two groups: (1) those who wrote in English at least every month (i.e. about once a month or more frequently) and (2) those who wrote less frequently or never. The results are presented as percentage values of the more active group (cf. 6.1.2 above and Figure 39; also Tables 29.1–29.5). Writing emerges as a minor activity for many of the text types, and the most common text type is writing e-mails. Before the merging procedure, the options, never and less frequently (than once a month) obtained the highest percentage values overall.
Comparisons by gender revealed that men write e-mails and on the internet in English more often than women, whereas women
write letters and postcards slightly more often than men (the proportion was still small, 8 %). In the other text types the differences
between the sexes were not statistically significant (Table 29.1).
The differences between age groups were statistically significant for all text types; the two youngest age groups were clearly more active
writers than the older age groups (Table 29.2). Particularly large differences were detected in writing stories and poems (cf. Leppänen 2008), in which the 15–24 age group were significantly more active (12 %) than the other age groups (3 % or less). Writing on the internet was similarly more common among the 15–24 age group (33 %). Among the 25–44 age group the proportion fell to 19 %, and for those over 44 it was 3 % or less.
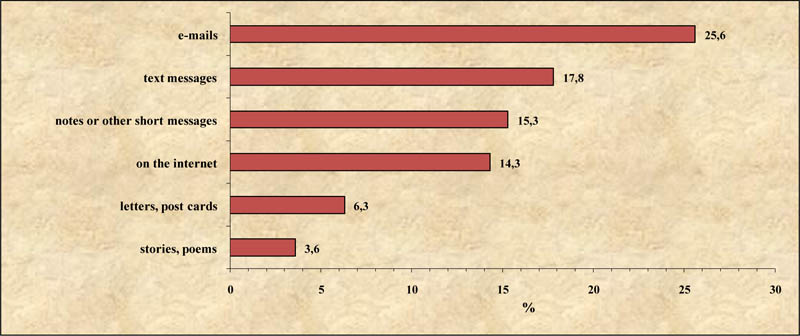
FIGURE 39 The percentages of writing in English in different types of situations at least every month
Areas of residence seem to be consistently divided into two groups: in all text types, writing in English was clearly more common in the
cities than anywhere else (Table 29.3). In addition, the countryside differed from the more densely populated areas in the case of electronic communication (less common in the countryside). Differences between areas of residence were not statistically significant for writing letters and postcards.
When compared by level of education, the most active writers in English were those with a university degree (Table 29.4). However, as regards writing stories and poems, respondents who had completed lower secondary education (i.e. typically young people between the ages 16–19) were particularly active.
Compared to other occupations, managers were clearly more frequent writers of e-mails, text messages and notes or other short
messages in English (Table 29.5). Experts emerged as the most active writers on the internet. Except for text messages, healthcare workers emerged as less active writers in English than the others for each text type; manual workers wrote the fewest text messages. However, manual workers were the second most active writers on the Internet, right behind experts.
6.1.5 Speaking English in free time
Question 30 asked respondents how often they spoke English in their free time. The options were as follows:
(a) with your Finnish-speaking [or for Swedish speakers: Swedish-speaking] friends,
(b) with your non-Finnish-speaking [or for Swedish speakers: non-Swedish-speaking] friends,
(c) with tourists in Finland,
(d) when expressing negative feelings (such as when swearing),
(e) when expressing positive feelings (such as love).
Note that in the questionnaire in Swedish, the terms Finnish-speaking and non-Finnish-speaking were replaced with Swedish-speaking and non-Swedish-speaking.
Answers were given on a five-point scale (almost daily, about once a week, about once a month, less frequently, never), but we again
divided the respondents into (1) those who spoke English at least every month (i.e. about once a month or more frequently) and (2) those who spoke English less frequently or never. The results are presented as percentages of the more active group.
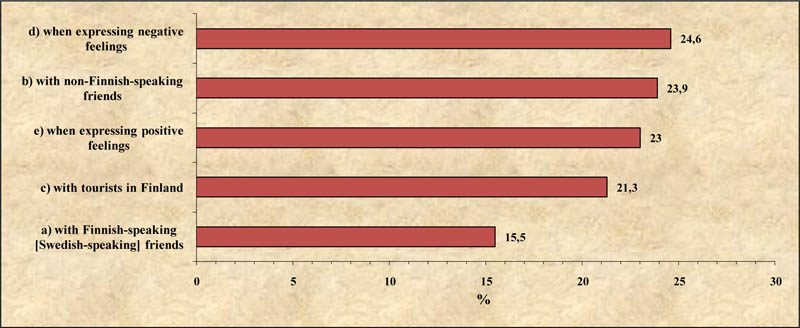
FIGURE 40 The percentages of speaking English in different types of situations at least every month
Figure 40 shows that 16–25 % of the respondents (depending on the situation) spoke English in their free time at least once a month. The proportion tended to be slightly higher among men than women (except for (e) expressing positive feelings, which was more common among women); however the differences did not quite reach statistical significance (Table 30.1).
The differences between age groups were statistically significant for all the situations (Table 30.2). Thus the younger age groups emerge as more active speakers of English than older age groups. Among those aged 15–24, expressing negative feelings was prominent (option (d), chosen by as many as 51 % of this age group). Nevertheless, positive feelings also emerged strongly, being chosen by more than one third of this age group.
The age group vs. activeness trend was broadly similar for all the situations, except that the 25–44 age group emerged as the most active
speakers with tourists. For respondents aged 65–79 the most common speech context was with non-Finnish-speaking [non-Swedish-speaking] friends. For those aged 45–64 it was speaking with tourists in Finland, and for those aged 15–24 it was when expressing negative feelings.
Differences between areas of residence were statistically significant for all situations except for (e) when expressing positive feelings (Table 30.3). Speaking English with Finnish-speaking [Swedish-speaking] friends was significantly less frequent in the countryside (9 %) than elsewhere (14–18 %). In the other three situations (d) when expressing negative feelings, (b) with non-Finnish-speaking [non-Swedish-speaking] friends, and (c) with tourists in Finland there was a clear division between the cities and the other areas. The difference was greatest in speaking English with non-Finnish-speaking [non-Swedish-speaking] friends and tourists in Finland. These uses were twice as common in the cities as in other areas.
Percentages by levels of education showed that respondents with the lowest level of education (primary school only) had the lowest values for
English-speaking in their free time (Table 30.4); this was a predictable result. For these respondents the most common context for free-time English speaking was (e) when expressing positive feelings (14 % at least once a month). Respondents with a university degree were among the most active speakers of English in all the contexts. They showed particularly high values in terms of speaking English with non-Finnish-speaking [non-Swedish-speaking] friends (45 %), and with tourists in Finland (35 %).
Nevertheless, respondents who had completed lower-secondary education (a group which includes many young people between the ages 16–19)
showed remarkably high values in three contexts: (a) with Finnish-speaking [Swedish-speaking] friends (23 %), (d) when expressing negative feelings (32 %), and (e) when expressing positive feelings (26 %). The differences between levels of education were statistically significant in all contexts except with regard to expressing positive feelings.
In comparisons by occupation, speaking English in free time was least common among healthcare workers and manual workers (Table 30.5). Among the healthcare workers the most frequently mentioned context for speaking English was (e) when expressing positive feelings (21 %), and among manual workers it was (d) when expressing negative feelings (20 %). As regards expressing feelings, both positive and negative, office and customer service workers were the most active (with 28 % in both contexts).
Managers are the occupational category showing the most frequent use of spoken English with non-Finnish-speaking [non-Swedish-speaking]
friends and tourists (in both contexts over 30 %). The differences between occupations were statistically significant in all contexts except for (a) with Finnish-speaking [Swedish-speaking] friends.
6.1.6 Uses of English: Summary
In general, men were slightly more active users of English than women, but there were specific contexts in which women were more active (reading literature, writing letters or postcards, expressing positive feelings in speech).
The two youngest age groups (15–24 and 25–44) were in almost all areas more active users of English than the two oldest age groups (45–64 and 65–79). The contexts in which the youngest age group was clearly more active than the 25–44 age group were on the productive side of language use (writing stories and poems, writing on the internet, expressing negative feelings, and speaking with Finnish-speaking [Swedish-speaking] friends). The 15–24 age group also clearly exceeded the 45–64 age group in almost all contexts, though the difference was only marginal in the case of reading English nonfiction or professional literature and speaking with tourists. However, these were also the contexts in which 25–44 age group were clearly more active than those aged 15–24, and this was the case also with reading magazines (general interest/hobbies). The oldest age group was the least active in almost all given contexts, only rivaled by the age group 45–64 in a couple of contexts.
As was mentioned above, comparisons by area of residence showed a division between cities and the other three areas fairly consistently.
Overall, country dwellers were less active users of English than the others; the difference was clearer in reading than in the other three areas
of language use. For one reason or another, rural centres gave slightly higher proportions of English use than did towns (defined as towns
of less than 50,000 inhabitants, see Chapter 2).
When compared by level of education, respondents with a university degree were clearly much more active than respondents with a primary education only. The polarisation was strongest in terms of reading in English. Nevertheless, younger respondents, especially those who had completed lower secondary education, emerged strongly in terms of writing stories and poems, writing on the internet, speaking with Finnish-speaking [Swedish-speaking] friends, and expressing both negative and positive feelings.
Listening in English was the context least dependent on the respondent’s education: only those respondents whose education was limited to
primary school stood out by virtue of their low percentages.
Occupations were found to divide into three groups: managers and experts were the two most active users of English, and healthcare workers
the least active. Office and customer service workers and also manual workers were mostly placed between the most active and the least active group, close to the mean values for the total data. This was another division which applied most strongly to reading in English. Manual workers were less active than healthcare workers only in speaking English and in reading literature in English. As far as listening in English and writing on the internet are concerned, managers are not distinguished as more active than the rest. The characteristic contexts of English use for experts, especially in comparison to managers, are writing on the internet and reading literature.
Despite the differences listed above, listening, reading, writing, and speaking in English do not differ from one another radically; instead,
basic divisions can be detected to varying degrees in all four areas of language use, and in relation to all five variables.
6.1.7 Use of English on the internet and in playing electronic games
Question 31 concerned the use of English on the internet and in playing electronic games. The question listed the following:
(a) searching information (e.g. Google),
(b) reading newspapers on the internet,
(c) ordering products or using services on the internet,
(d) having spoken discussions over the internet (via e.g. Skype),
(e) having written discussions over the internet (via e.g. Messenger or IRC),
(f) following discussion forums or weblogs,
(g) playing internet-based games,
(h) playing computer or console games.
In this case, as in the previous section, the answers were classified within two groups, namely: (1) those who use English at least once a
week (i.e. about once a week or more frequently) and (2) those who use English less frequently or never. The results are presented as percentages of the more active group (cf. 6.1.2 and Figure 41; also Tables 31.1–31.5). We also examined the data with monthly use as criterion for group division instead of weekly use, but the conclusions were practically the same and are therefore not reported here separately.
Figure 41 shows that the most common use of the internet in English is clearly searching information. This was something that
almost half of the respondents engaged in at least once a week.
The data indicate that every type of use of English on the internet, and particularly playing electronic games, is more common among men
than women (Table 31.1). Having spoken discussions over the internet was the only context in which the difference between the sexes was not statistically significant. Among women the only significant purpose for the weekly use of English on the internet was (a) searching information, which was mentioned by 37 % of women (among men the proportion was 58 %). In all other contexts the rate of weekly use for women was clearly below 10 %. Among men the most common contexts for weekly use were (coming after searching information) the following: (b) reading newspapers on the internet (19 %); (f) following discussion forums or weblogs (18 %); (h) playing computer or console games (17 %).
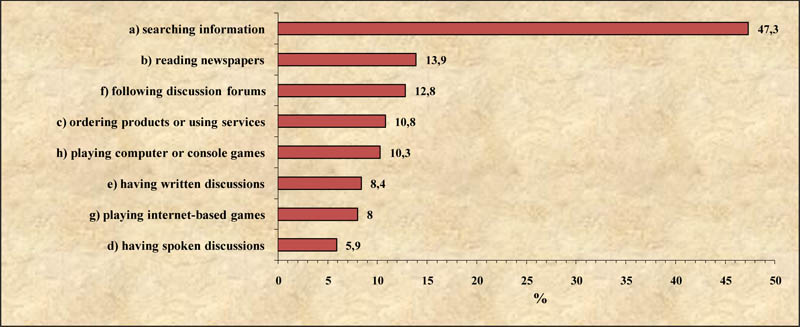
FIGURE 41 The percentages of the respondents who use English while using the internet or playing electronic games at least weekly
The differences between age groups were obvious in all cases (Table 31.2). In weekly use, the 15–24 age group was the most active in all contexts except for reading newspapers on the internet, in which the 25–44 age group was slightly more active. For nearly all the options the proportion of users decreased systematically among the older age groups. Among those aged 45 or older, it was somewhat rare to use the internet in English. The only purpose worth mentioning was searching information; this was something that 33 % of those aged 45–64 and 14 % of those aged 65–79 engaged in weekly. In the younger age groups the proportion was significantly higher (58–67 %). The two youngest age groups differed from one another in that playing electronic games and discussing over the internet (chatting) was twice as common among those aged 15–24 as among those aged 25–44, in terms of weekly use.
Differences between areas of residence (Table 31.3) emerge clearly in all the contexts except playing electronic games, i.e. options (g) and (h). Using the internet in English is most common in cities and least common in the countryside. A clear difference was detected between the cities and other areas. In addition, the countryside differs from rural centres in terms of searching information. The clearest result is that city dwellers are distinguished from the rest as the most active readers of newspapers over the internet (b), as participants in discussions over the internet (d) and (e), and as followers of discussion forums and weblogs (f).
Comparisons by level of education showed that respondents with the highest level of education were the most active users of the internet
in English (Table 31.4). However, playing electronic games in English was most common among respondents who had completed a lower secondary education, which basically means young respondents. As distinct from many other contexts, respondents with the lowest level of education emerged as the second most active group here.
When compared by profession, experts were the most active in (a) searching information, (b) reading newspapers on the internet,
(c) ordering products or using services on the internet, and (f) following discussion forums and weblogs (Table 31.5). Managers were almost as active. Manual workers were the most active players of electronic games: they were the only group among which the rate for playing in English weekly reached over 10 %. Healthcare workers were distinguished from the rest by their minor use of English on the internet and in playing electronic games.
6.1.8 Use of English at work
Question 32 concerned the use of English at work, and was aimed at respondents in working life. The respondents were asked to indicate on a five-point scale (almost daily, about once a week, about once a month, less frequently, never) how often they engaged in the following in English:
(a) reading manuals and product descriptions,
(b) reading nonfiction and professional literature,
(c) reading e-mails,
(d) reading web pages,
(e) reading documents,
(f) searching information (e.g. Google),
(g) listening to presentations or lectures.
In addition, they were asked to indicate how often they wrote the following in English:
(h) e-mails,
(i) documents.
They were further asked how often they were involved in the following activities in English:
(j) speaking with colleagues,
(k) speaking in meetings and negotiations,
(l) speaking with clients and partners on the phone,
(m) speaking with clients and partners face to face,
(n) giving presentations or lectures.
In the data as a whole, the options never and less frequently (than once a month) were emphasised the most in all contexts.
In this sense, the use of English at work would seem to be not very common. However, from now on, the results will be divided into two groups (as was done previously), based on weekly use. Hence we have (1) those who use English in their work at least once a week (i.e. about once a week or more frequently), and (2) those who use English less frequently or never.
In addition, the answers given to contexts (a)–(n) were used in gathering information about the percentages of respondents overall who use English weekly in their work. The percentages for weekly English use in different contexts and overall are presented in Figure 42. Comparisons by different background variables can be seen in Tables 32.1–32.5.
Figure 42 shows that 46 % of respondents in working life indicated that they used English in their work at least once a week. However,
the rate varied very significantly by different background variables. Weekly use was more common among men (52 %) than women (40 %), young people (55–63 %) than older people (22–33 %), and in cities (59 %) than in other areas (27–43 %). Over 60 % of the respondents with a university or polytechnic degree indicated that they used English in their work at least once a week, and the figure was similar among managers and experts
(almost 60 %). In comparisons by profession, healthcare workers had the least need of English in their work: only 16 % indicated that they used
English on a weekly basis.
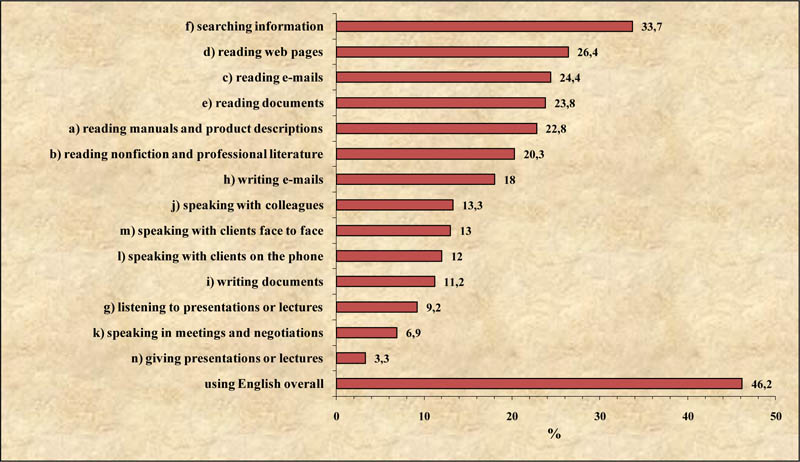
FIGURE 42 The percentages of the respondents who use English at least once a week while working (the percentages represent the number of positive responses relative to the respondents who work)
The most common context for English use at work was (f) searching information, in which approximately one third of the respondents
indicated activity at least once a week. Reading in English was generally more common than writing and speaking (particularly reading e-mails, web pages, and documents). Giving presentations or lectures and speaking English in meetings and negotiations were the least common of all the options.
Comparisons by gender, age group, and other background variables showed differences fairly similar to differences in English use in general.
Men used English more frequently than women (Table 32.1), with the exception of speaking with clients (contexts (l) and (m)), which was chosen by women slightly more frequently than by men (not statistically significant). The 25–44 age group used English in many contexts more frequently than other age groups; in particular, work-related communication in English via writing, speaking, and via e-mail seemed relatively common among them (Table 32.2). City dwellers, highly educated people, managers, and experts were also distinguished by their active use of English, regardless of the context. Regarding healthcare workers, it again appears that their use of English at work is minor (Table 32.5). The same applies to English use in the countryside (Table 32.3).
6.1.9 Opinions concerning personal English use
Question 33 derives from a need to find out how Finns see themselves as users of English, especially in terms of naturalness, fluency, and necessity. Five statements eliciting the respondents’ opinions on their own English use were presented in the question, as follows:
(a) using English is as natural to me as using my mother tongue,
(b) I always use English when I have an opportunity to do so,
(c) I use English only when it is absolutely necessary,
(d) when using English it is important for me to sound fluent,
(e) using English is easier with native speakers than with non-native speakers of English.
The respondents were asked to give their opinion on a five-point scale (strongly agree, agree, disagree, strongly disagree, no opinion). Figure 43 and Tables 33.1–33.5 give the percentages for strongly agree and agree together.
In the data as a whole, only about one quarter of the respondents indicated that using English was (a) as natural to them as using their
mother tongue. No statistically significant differences were found between the sexes, but in comparisons by other background variables, the
differences were significant. In the youngest age group (15–24), 41 % of the respondents found using English natural, whereas in the oldest age
group (over 64) only 7 % felt this way. In addition among young respondents, city dwellers (37 %), highly educated people (48 %), and managers
(40 %), there was clearly above-average frequency for the sense of English being as natural as the mother tongue.
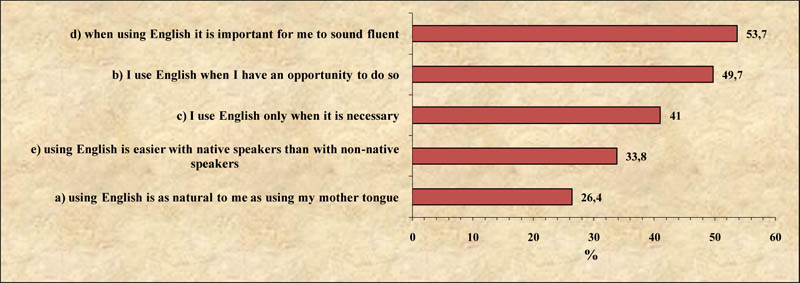
FIGURE 43 The percentages of the respondents agreeing with the given statements
Regarding the statements (b) I always use English when I have an opportunity to do so and (c) I use English only when it is absolutely necessary, the respondents had opposite opinions for obvious reasons. Approximately half of the respondents responded positively to statement (b), and somewhat above 40 % to statement (c). No differences between the sexes were detected. Willingness to use English was greatest among the younger age groups, city dwellers, the highly educated, managers, and experts. Correspondingly, among the oldest age groups, non-city dwellers, the less educated, healthcare workers, and manual workers it was most common to use English only when it was felt to be absolutely necessary.
More than half of the respondents indicated that it was (d) important for them to sound fluent when they used English. This was
especially the case among those aged 15–24 (71 %), city dwellers (66 %), respondents with a university degree (70 %) or polytechnic degree (63 %), and experts (60 %). The groups least frequently expressing this opinion were those aged 65–79 (24 %) and country dwellers (35 %). Women had this opinion slightly more frequently than men, but the difference was not statistically significant (Table 33.1).
Overall, statement (e) using English is easier with native speakers than with non-native speakers of English received disagreement (49 %) somewhat more than agreement (34 %). The respondents most frequently agreeing were city dwellers (40 %), highly educated persons (40–47 %), and managers (43 %). Those agreeing more frequently than the average were women, persons under 45, and experts. Those agreeing least frequently with statement (e) were respondents with no more than a primary education (18 %), the oldest age group (25 %), and country dwellers (24 %).
6.1.10 Reasons for using English
Question 34 aimed at finding out the reasons for Finns’ use of English; for example, if they find using English a pragmatic tool for communication or an inevitable constraint. The respondents were asked to consider even minor amounts of speaking, reading, and writing as language use. Possible reasons were as follows:
(a) to communicate with people,
(b) to learn it better,
(c) for the fun of it,
(d) when there are no other alternatives,
(e) to search information,
(f) for my work,
(g) for my studies,
(h) in leisure activities and among friends.
The respondents were asked to give their answers on a five-point scale (almost daily, about once a week, about once a month, less frequently, never). The options almost daily and about once a week were combined into at least once a week, and the results were examined by percentage values of the combined category (cf. 6.1.2; see also Figure 44, and Tables 34.1–34.5).
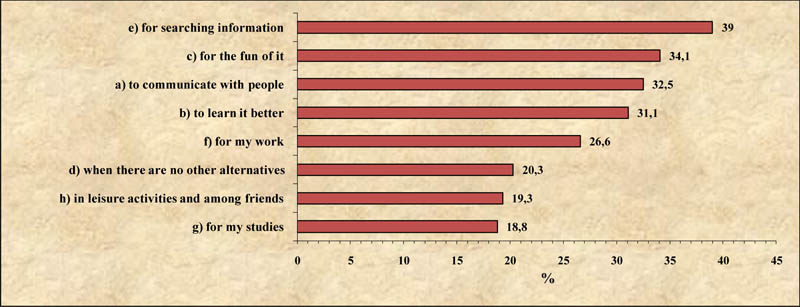
FIGURE 44 The percentages of the respondents in whole of the population who use English in different types of situations at least once a week
In general, the respondents indicated use of English for several different reasons. The respondents who indicated that they used English weekly mentioned four reasons on average. In the data taken as a whole, the most frequently mentioned reasons were (e) to search information (39 %), (c) for the fun of it (34 %), (a) to communicate with people (32 %), and (b) to learn it better (31 %). If we examine only those respondents who indicated that they used English for at least one reason, the proportion of those searching information among these active users is as high as 68 %. Using English for the fun of it, to communicate with people, and to learn it better were also frequently mentioned reasons, all with values higher than 50 %.
Comparisons by background variables again revealed that irrespective of the reason, the weekly use of English was generally more common
among men, the young, city dwellers, the highly educated, managers, and experts (Tables 34.1–34.5).
Among men, the most common reason and the main difference from women (Table 34.1) concerned (e) to search information. Among women (a) communicating with people and (c) using English for the fun of it were rated as high as to search information. In comparisons by area of residence, it was only in the cities that searching information was clearly the most common reason for using English (Table 34.3). In comparisons by occupation, using English for the fun of it rather than to search information was more common among the less educated and among healthcare workers. Office and customer service workers most frequently mentioned communicating with people as the reason for using English (Table 34.5).
6.1.11 Respondents as speakers of English and of the mother tongue: self-comparisons
Question 35 aimed at finding out how Finns viewed their own English use and themselves as speakers of English. Respondents who designated themselves as speaking at least a little English (but not as their mother tongue) were asked to compare themselves as users of English and as users of their mother tongue. They were asked to choose several (if necessary) of the thirteen options (a)–(m) to describe themselves as users of English, as follows:
When I speak English I
(a) need to search the proper words,
(b) gesticulate more with my hands,
(c) use more facial expressions,
(d) use utterances such as yeah, mmm, uhuh more,
(e) speak slower,
(f) am quieter,
(g) am more talkative,
(h) use less humour,
(i) feel like an outsider,
(j) feel more stupid,
(k) feel smarter,
(l) feel less capable,
(m) am the same as I am when I use my mother tongue.
The respondents could choose several options. In the data as a whole, the percentages were as presented in Figure 45. Distributions by different background variables can be found in Tables 35.2–35.5. In the analysis we needed to consider that some of the statements, for example (e) and (i)–(m), could indicate that one viewed one’s language skills as ‘adequate’ or ‘inadequate’, whereas some statements cannot be unambiguously associated with such a division, for example statements (b)–(d) and (h).
The majority (77 %) of the respondents indicated that they (a) searched the proper words when speaking English, and almost half
indicated that they (e) spoke more slowly. Approximately 40 % of the respondents indicated that they (f) were quieter, (b) gesticulated more with their hands, and (l) felt less capable. Only a few indicated that they (g) were more talkative (3 %) or (k) felt smarter (3 %). Around 12 % of the respondents indicated that they (m) were the same as when using the mother tongue.
Some statistically significant differences were detected between the sexes (Table 35.1). Women chose alternatives (b) (more gesticulation with the hands) and (c) (use of more facial expressions) more frequently than men. In addition, (f) (being quieter), (j) (feeling more stupid), and (a) (having to search the proper words) were mentioned more frequently by women than men. Overall, it would seem that women view their English skills as inadequate somewhat more frequently than men. However, concerning many of the alternatives, there was no difference between the sexes, or the opposite picture (stronger self-evaluations for women) might even emerge.
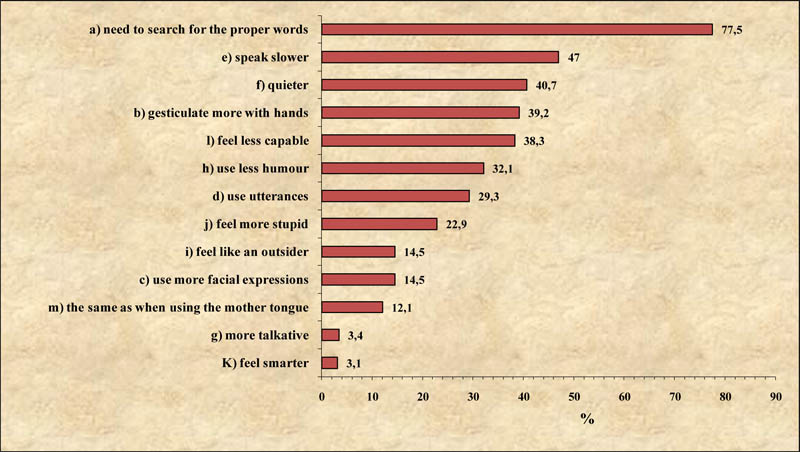
FIGURE 45 The percentages of the respondents who agree with the given statements comparing speaking in English to speaking in the mother tongue
Respondents in the youngest age group chose alternatives (d) (using more utterances such as yeah, mmm, uhuh) and (h) (using less humour) more frequently than the others, but they also chose alternative (a) (needing to search the proper words) less frequently than the others (Table 35.2). Compared to the other age groups, the 25–44 age group had a clear preference for (m) (being the same as when using the mother tongue) and a slight preference for (g) (being more talkative in English). Typical of the two oldest age groups was having to search the proper words, speaking more slowly, and feeling like an outsider.
Comparisons by area of residence showed that city dwellers indicated much more frequently than others that it was the same to them whether they spoke English or the mother tongue (m). In addition, they chose alternatives (e) (speaking more slowly), (f) (being quieter) and (b) (gesticulating more with hands) less frequently than others (Table 35.3). Country dwellers chose alternatives (j) (feeling more stupid) and (c) (using more facial expressions) more frequently than the others. Contrary to the results so far, in this respect the respondents living in the rural centres differed from the rest. They indicated feeling like outsiders and feeling more stupid even less frequently than city dwellers.
In comparisons by level of education, statistically significant differences were found concerning only a few of the statements
(Table 35.4). The most obvious difference concerned seeing oneself as the same regardless of the language spoken, i.e. statement (m). Among the highly educated respondents, 21 % indicated that it was the same to them whether they used English or the mother tongue, whereas among the less educated the rate was under 10 %. Highly educated respondents also indicated less frequently than the others that they gesticulated with their hands when speaking English. Feeling more stupid was more common among the less educated than the highly educated.
Comparisons by occupation revealed statistically significant differences concerning six statements (Table 35.5). In respect of these, managers on one hand and healthcare workers on the other differed from the other occupations. “Self-confidence” in speaking English seemed in many respects to be highest among managers and lowest among healthcare workers. The proportion (35 %) of managers who indicated that it was the same for them whether they spoke English or their mother tongue was higher than in the other occupations. Only 4 % of the healthcare workers were of this opinion. Managers indicated less frequently than other occupations that they (a) needed to search the proper words, (b) gesticulated with their hands, or (l) felt less capable when speaking English. The experiences of “difficulty” were more common among healthcare workers. Healthcare workers also indicated more frequently than others that they (c) used more facial expressions when they spoke English. Using less humour when speaking English was most common among experts and rarest among managers.
6.2 Summary and discussion
The results in this section demonstrated a clear difference between the highly educated respondents and the less educated respondents, and those doing manual work. The differences were obvious: in many respects Finns seem to be divided into those who use and those who do not use English. The dividing line between areas of residence was usually drawn between the cities and other areas, but the countryside was also distinguished from the more densely populated areas. The younger age groups also differed from other age groups: it would seem that for them English is already part of their daily life; in contrast, for the older age groups English still appears to be a foreign language – found interesting, encountered at work and in free time, but not actively used to any great extent.
The oldest respondents and country dwellers use less English than the other reference groups in every way. In free time, English is used
mostly by young respondents (particularly those aged 15–24), city dwellers, the highly educated, managers, and experts. The youngest respondents
were the most active in speaking English, especially to express feelings (though this might be in the form of single words or phrases, for example as swearwords).
In public debate, many people have expressed their concern about English invading working life and areas of language use in the academic
world (Hiidenmaa 2003; Hakulinen et al. 2009). It is true that managers and highly educated people in general seem to use English extensively in their work. However, the survey results overall suggest that the role of English may actually be more prominent in Finns’ free time than in working life.
Listening, speaking, reading, and writing in English
The vast majority of Finns listen to English-language music (in particular) and also English speech in subtitled TV programmes or films. The two latter contexts were the most frequent contexts of English use in the whole survey, including reading, writing, and speaking. Thus, English enters the lives of most Finns through traditional electronic media, popular culture, and music. As was discussed in the Introduction, English-language music has had a foothold in Finland for decades, and the same goes for television programmes broadcast in English.
In comparison to listening, the activities of speaking, reading, and writing were less prominent. Speaking and writing English do not seem to be needed in the mainly monolingual everyday life of Finns. Finns still manage their daily lives mainly in their mother tongue.
Overall, Finns write relatively little English, the internet being the most typical context for writing. Yet once again, certain
groups – the young, city dwellers, the highly educated, and managers – write more than other groups. Moreover, with regard to questions concerning web texts (see questions 31–32), young respondents are distinguished from the others in that a great proportion of them write web texts in English at least once a month. Overall, younger respondents write more than older
ones; respondents who have completed a lower secondary education and manual workers are particularly active in writing web texts in English. This would lead one to consider whether the opportunities for writing offered by the internet have constituted a more equal arena for persons whom one might expect to be less active in writing, i.e. the less educated and manual workers. However, the interactive websites have their own peer-regulated norms of what is good language use (cf. Leppänen 2009).
Use of English on the internet
Half of the respondents searched the internet for information weekly. In particular, respondents with the highest level of education, managers, and experts emerge as the most active in this respect. A minority of the respondents use the internet for other purposes (discussions, games, shopping). The results reveal a generation gap: the two youngest age groups are the most active in reading websites, playing electronic games, and chatting in English. Questions on using the internet and the new media reveal that to young respondents the electronic media – and especially the internet – are a context of language use where English is used and needed (cf. Leppänen et al. 2008). To persons aged over 44, searching information is the only purpose for using the internet in English; even in this they are clearly less active than the youngest age group. Country dwellers also are less active users of English-language websites than others. Men and highly educated persons are distinguished as the most active users of English on the internet, but internet-based games are played in English most frequently by respondents who are still at school or studying.
In the youngest age group, on a daily basis, one can see that the respondents read more electronic texts than print media in English. One can also see that highly-educated persons use somewhat more electronic media daily in English than the less educated. In addition, they read more printed texts in English in their free time compared to the less educated.
Using English at work
As was mentioned above, using English in free time is in general terms more common than using it at work. However, almost half of the respondents in working life reported weekly use of English specifically in their work. The most active readers and writers of English texts were men, persons aged 25–44, city dwellers, the highly educated, managers, and experts (cf. Virkkula 2008; Alatalo 2006). Hence, the answers to this question confirmed a tendency that is repeatedly observable in this survey. The use of English was equally distributed over many contexts, and the most common context of English use at work was searching information. However, as one might expect, healthcare work does not include much English use. The most typical context in which English is encountered at work is reading, which is more common than writing and speaking English at work. English is used when searching information on the internet and when reading e-mails, websites, and documents. This reflects the characteristics of working life in a changing world: information has become easily and quickly available, particularly on the internet. Moreover, the amount of information available is much greater in English than it is for example in Finnish or Swedish.
Overall, the use of English in working life divides Finns more clearly than the use of English in free time. City dwellers are distinguished as the most active users of English, both at work and in free time; by contrast, people in rural centres and in the countryside seem to use English less actively at work than in free time. This can be partly explained by differences in sources of livelihood: in the countryside the role of primary production is relatively large, whereas cities have a more extensive service sector, implying a greater need to use English than in primary (or secondary) production. In the same way, differences in levels of education and in occupations are more clearly distinguished from each other in terms of differences in English use at work as compared to English use in free time.
Finns’ opinions of themselves as users of English
Only one quarter of the respondents viewed their English use as being as natural as their use of the mother tongue; this is particularly the
opinion of young people, highly educated people, and managers. However, approximately half of the respondents use English in contexts that go beyond sheer necessity. Younger respondents, city dwellers, the highly educated, managers, and experts typically use English whenever they have the opportunity to do so, whereas older respondents, country dwellers, the less educated, and manual workers use it only when they have to. Approximately half of the respondents also saw it as important to sound fluent – again the youngest age group, city dwellers, the highly educated, managers, and experts stood out. The majority saw it as easier to use English with non-native speakers than with native speakers of English. Perhaps the lingua franca use of English is felt to provide a more equal basis as compared to communication with a native speaker (cf. Seidlhofer 2001; House 2003). In principal, Finns are willing to use English, but when they use it, they are not content with their skills (cf. the admiration for native speakers discovered in Chapter 4). This may partly explain the fact that so many want to learn more English.
Reasons for using English
The most typical reason for Finns to use English is searching information. Other essential reasons include the need to communicate with people with whom there is no other common language, a desire to improve their English skills, and simply the fun of using the language. For one quarter, English is necessary at work, and one fifth see no alternative to the use of English. To search information and for communication, English is used to the greatest extent by men, younger respondents, city dwellers, the highly educated, managers, and experts.
Finns as speakers of English and the mother tongue
All in all, the answers reflect a certain degree of uncertainty in Finns’ English use. More than half of the respondents expressed a need to search for the proper words and felt themselves to be slower when speaking English. The majority of the respondents also felt that when speaking English they spoke less and were less capable compared to when they spoke their mother tongue. In particular, women, older age groups, the less educated, country dwellers, experts, and healthcare workers appeared to be more uncertain and cautious in their use of English. The highly educated, managers, and city dwellers had less negative opinions about themselves as users of English. A high proportion of the highly educated – and particularly managers – claimed that it was the same for them whether they spoke English or the mother tongue. For these groups the difference between communication in the mother tongue and communication in English seems to be less radical than it is for other groups – perhaps they already view themselves functionally bilingual. The same seems to apply to younger Finns.
The results seem to support an interpretation according to which English is still considered a foreign language more than an “owned” communicative resource. Thus, English is in many respects far from having the status of a “third domestic language”. Nevertheless, it does appear that Finland is at a turning point, i.e. at a stage where attitudes to English and the use of English are changing. The change can be seen as happening more quickly in respect of the different age groups than the other background variables. Twenty years from now, the age groups will have moved one step forward (e.g. age group 45–64 will become age group 65–84, etc.). The use of English among the new 15–24 age group may then be even more common than it is at present.
Back to top
|
|

